|
|
 |
|
|
|
|
|
Physical model for absorption of intraocular gas
Digital Journal of Ophthalmology 2013
Volume 19, Number 2
May 20, 2013
DOI: 10.5693/djo.01.2013.01.002
|
Printer Friendly
Download PDF |
|
|
|
|
| Abstract | Purpose
To present a physical model for intraocular absorption of an inert gas used as a tamponade.
Methods
The absorption kinetics of gas in contact with the retinal surface is examined, including the changing geometry of the shrinking gas bubble inside the eye.
Results
An analytic solution is derived that predicts how the bubble dimensions change with time, yielding a formula for the lifetime of the gas bubble. Comparison to an experimental measurement shows that the analytic solution accurately replicates the time evolution of the bubble geometry. The result is also compared to an alternative exponential model, which does not predict a finite bubble lifetime.
Conclusions
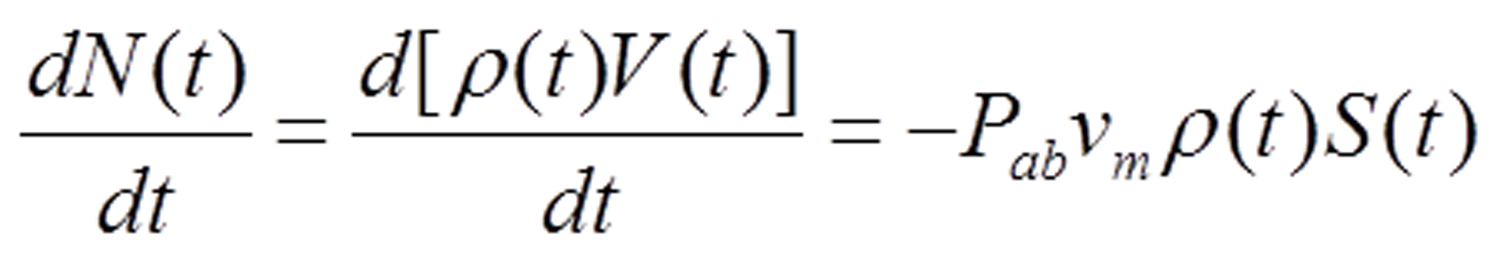
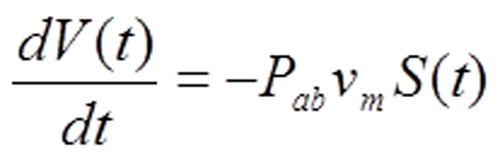
Further experiments are needed to discriminate between the surface absorption and exponential models. | | | Introduction | | Published models(1) of intraocular gas absorption assume that the rate of change of intraocular gas volume is proportional to the remaining gas volume V(t). The model can be written dV / dt = −V / τ. The resulting exponential decay of gas volume is used to determine a value of the gas "half-life" τ from experimental observations of intraocular gas absorption. This study describes an alternative model and compares it with patient observations from personal experience (the author underwent a pars plana vitrectomy with sulfurhexafluoride gas bubble tamponade at Duke University Eye Center, July 2011). The model assumes that the number of gas molecules absorbed per unit time is proportional to amount of gas in intimate contact with the retinal surface and the retinal vasculature. It can be expressed in terms of a single time-dependent geometric parameter that can be easily tracked by a patient or caregiver as the gas bubble is absorbed. | | | Materials and Methods | The number of molecules absorbed per unit time by the interior surface of the inner retina in contact with the gas is described by a rate equation 〈Equation 1〉, where ρ(t) is the number of molecules per unit volume, N(t) = ρ(t)V(t) is the number of molecules in the gas bubble, V(t) is the gas bubble volume, S(t) is the contact area of the gas bubble with the retinal surface, Pab is the probability of absorption of a molecule at the gas-retina interface, and vm is the speed of molecules in the gas.
Inside the gas bubble, the pressure does not change appreciably as gas is absorbed. Consequently the molecular number density ρ(t) of the gas is for practical purposes time independent, which simplifies Equation 1. What remains describes how the bubble dimensions evolve over time: 〈Equation 2〉.
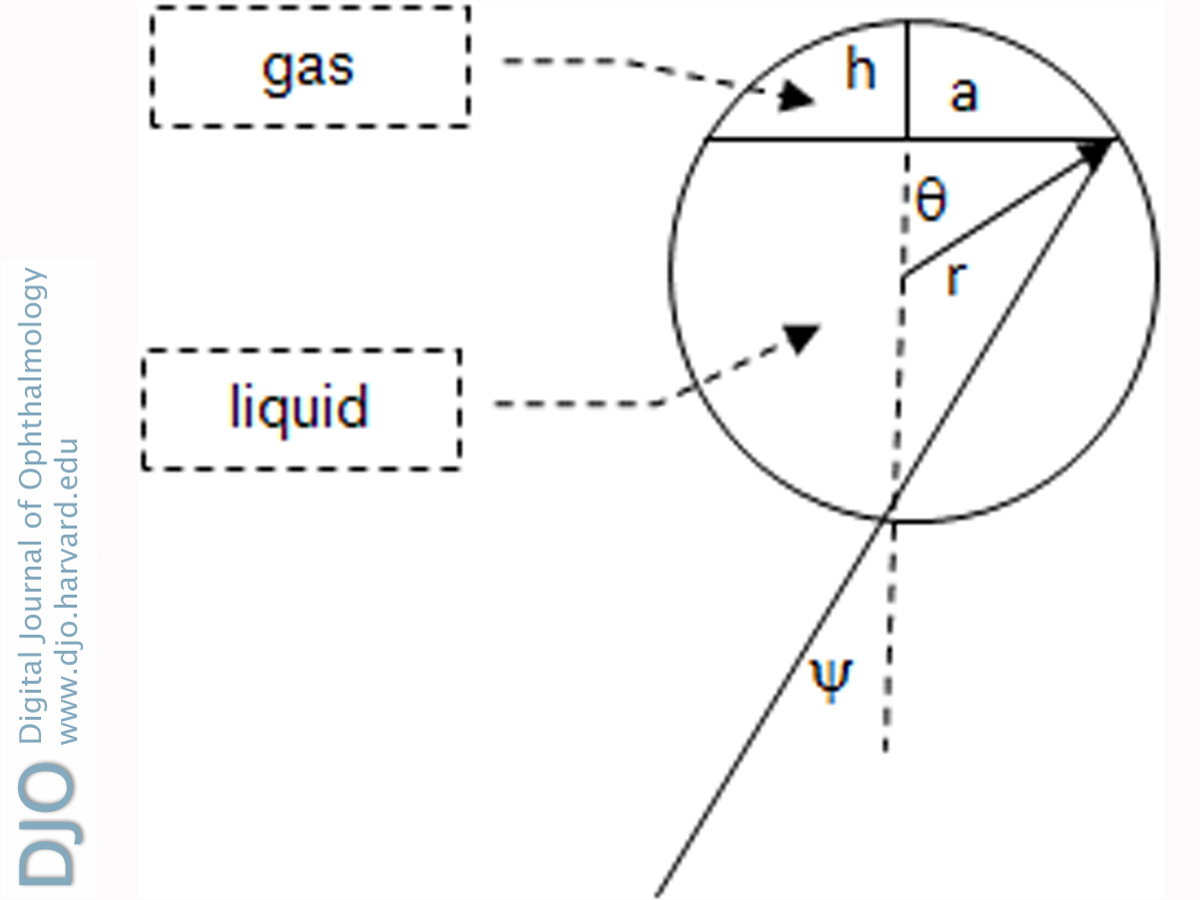
The geometric parameters in this equation can be expressed in terms of the angle ψ(t), defined in Figure 1. (With an intraocular bubble, looking straight down, the author measured ψ(t) using, for example, floor tiles as a grid.)
Figure 1 shows the geometry when the eye is looking straight down. The cap represents the gas bubble in a sphere of radius r. The cap diameter is 2a, and its height is h. Geometry of an isosceles triangle gives ψ = θ / 2. Using trigonometry, the volume and surface area of the bubble in contact with the retina can be expressed in terms of the angle ψ. Then the rate equation can be written in terms of the variable x = sin ψ: 〈Equation 3〉. | |

Equation 1
|
|
Equation 2
|
|
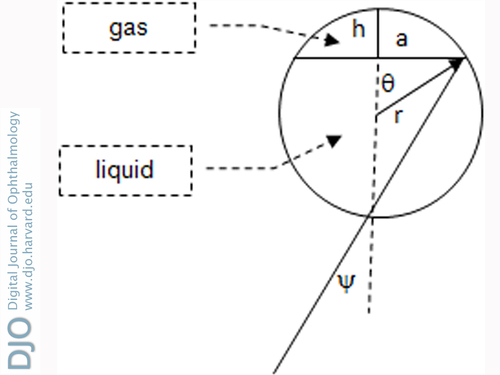
Figure 1
Gas bubble geometry with eye looking down.
|
|

Equation 3
|
|
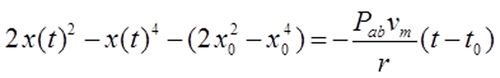
| Results | The differential equation can be integrated as in Equation 4 and solved to find ψ(t) as a function of time (the starting time is t0 = 0), thus: 〈Equation 5〉.
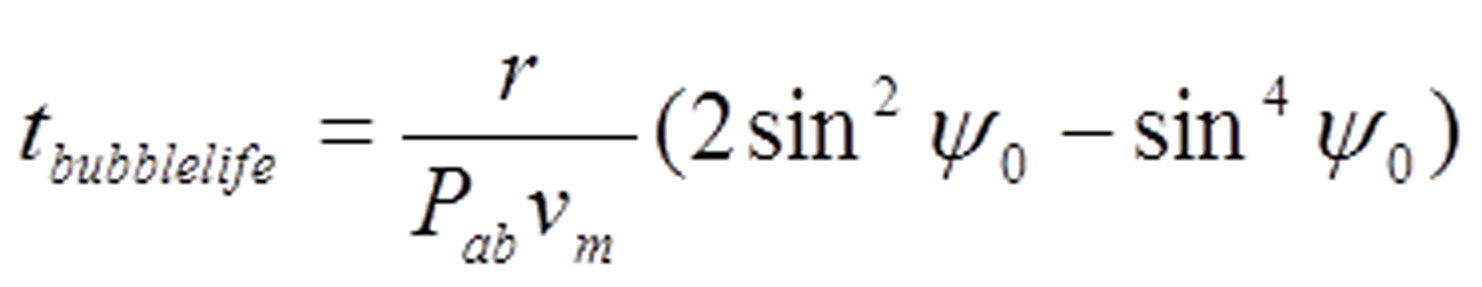
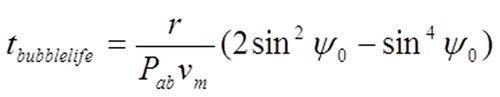
From Equation 5 the lifetime of the bubble is 〈Equation 6〉.
The bubble lifetime depends inversely on Pabvm, increases with eyeball radius r and depends on how much gas was initially put into the eye, measured by the starting value ψ0. | |
Equation 4
|
|

Equation 5
|
|
Equation 6
|
|
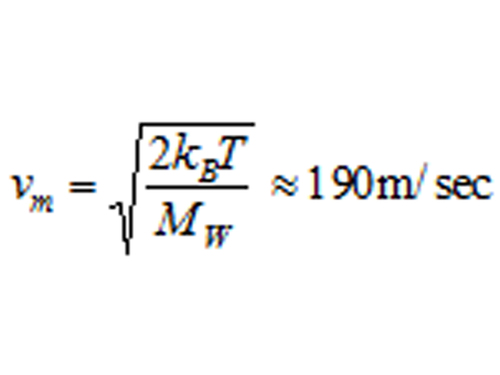
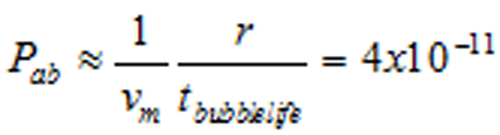
| Discussion | The author recorded his bubble’s size over time. It abruptly vanished at 17.5 days. Estimating 〈Equation 7〉, the gas absorption probability is 〈Equation 8〉.
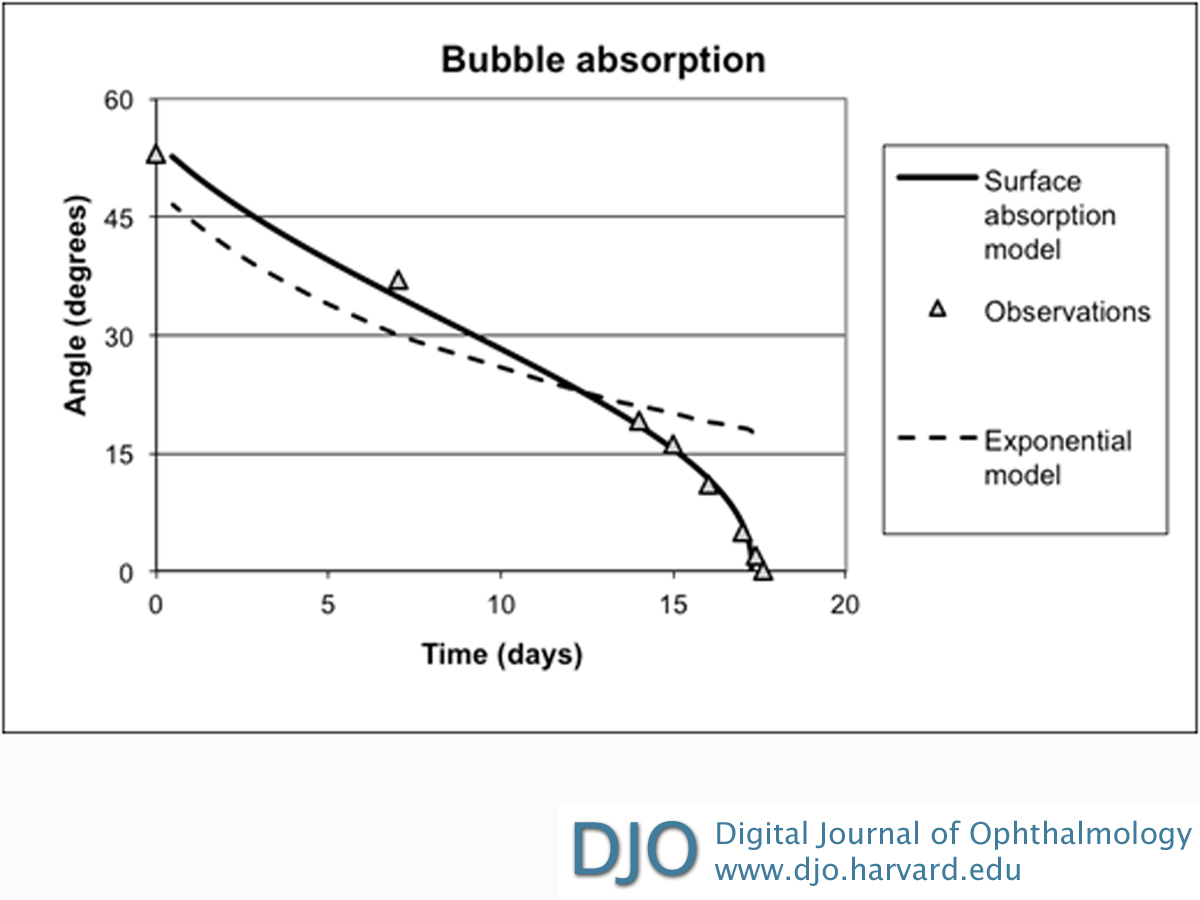
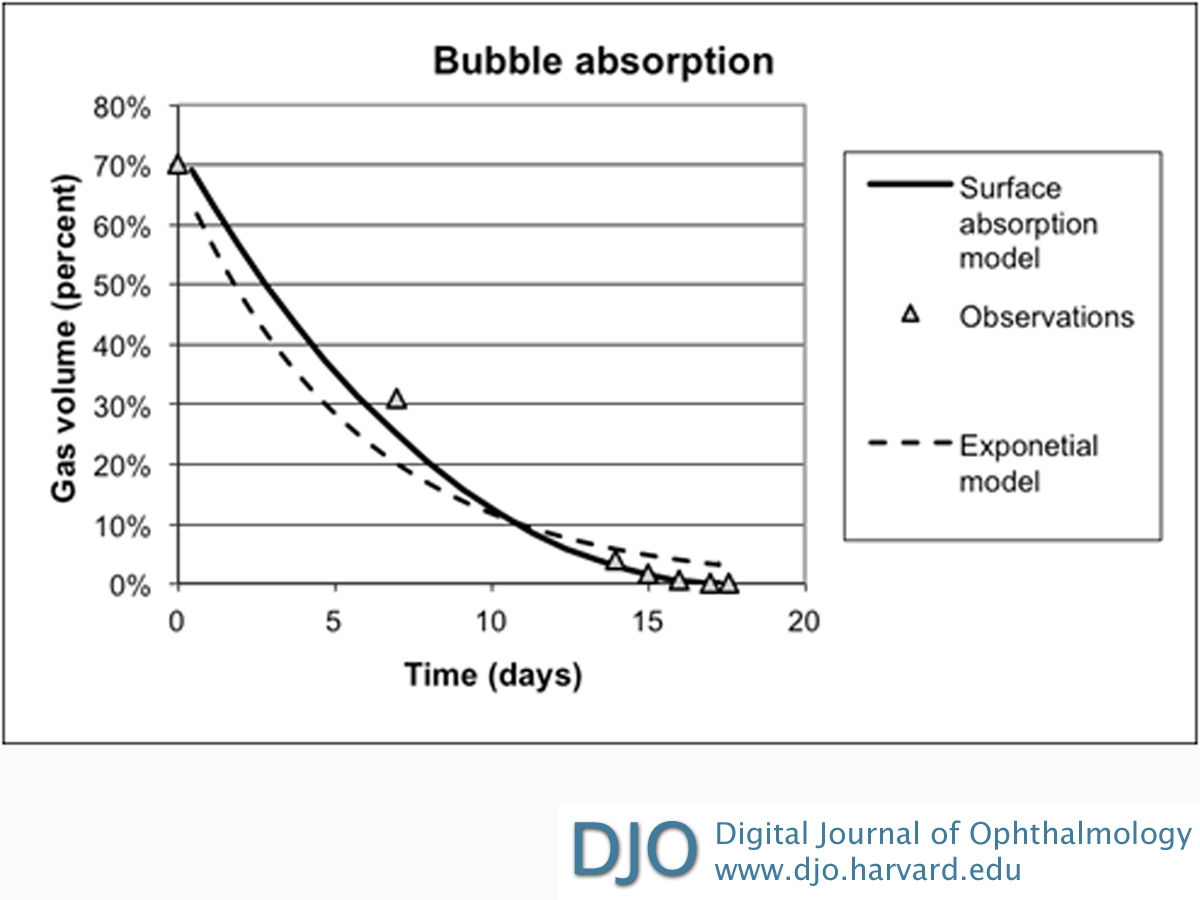
Figure 2 compares the author’s observations to the surface adsorption and the exponential models. Figure 3 repeats the comparison expressed in terms of the gas bubble volume computed from ψ(t). The surface absorption model tracks the observations quite well as the bubble size diminishes in the last quarter of life. It rigorously vanishes when t = tbubblelife, unlike the exponential model.
Additional experimental observations are needed with sufficient precision to discriminate between the surface and exponential absorption models. | |
Equation 7
|
|
Equation 8
|
|

Figure 2
Variation of angle Ψ(t) with time.
|
|

Figure 3
Variation of gas bubble volume with time.
|
|
| Acknowledgements | The author thanks Dr. Glenn J. Jaffe, MD, Chief Vitreoretinal Diseases and Surgery Service, Duke University Eye Center, Durham, North Carolina, for his encouragement.
| | | References | | 1. Thompson JT, Intraocular gases and techniques for air–fluid exchange. In Peyman GA, Meffert SA, Conway MD, Chou F, eds. Vitreoretinal Surgical Techniques. 1st ed. London: Martin Dunitz Ltd; 2001:157. | |
|
|
|
|
|
|
 Welcome, please sign in