|
|
 |
|
|
|
|
|
VOPTIX ©, A Computer Program for Graphical Display of Corneal Thickness Data
Digital Journal of Ophthalmology 1997
Volume 3, Number 9
December 1, 1997
|
Printer Friendly
|

James V. Schoster, DVM | University of Wisconsin School of Veterinary Medicine Cherif Ahrikencheikh, PhD | University of Wisconsin
|
|
|
| Abstract | Objective
A unique computer program was developed to store and display corneal thickness DATA taken FROM a variable array of corneal positions. The program was designed to graphically display the relative corneal thickness profile along any meridian FROM limbus to limbus as well as a collective representation of the DATA in a three-dimensional wire grid format. In this paper, the computer program, its graphical output and utilities are described and discussed. | | | Introduction | The importance of knowing the corneal thickness in humans and animals has steadily increased. Changes in corneal thickness reflects the health of the corneal endothelium and the status of the barrier function provided by junctional complexes between the adjacent endothelial cells that line the inner surface of the cornea as well as the adjacent cells of outer most epithelial cell layer. The corneal endothelium plays an active metabolic and structural role in maintenance of a relative dehydrated state of the corneal stroma to maintain corneal clarity. Primary or secondary conditions compromising corneal endothelial cell function will directly increase corneal hydration resulting in increased corneal thickness. Other factors such as corneal stromal swelling pressure, barrier dysfunctions of both the epithelium and endothelium, as well as evaporation FROM the corneal surface and changes in intraocular pressure also influence corneal hydration and therefore corneal thickness.
Pachymetry is a technique for measuring the corneal thickness in-vivo. Currently, pachymetry is being used in basic science, research, and as a clinical tool in ophthalmology 1-9. Although it is possible to obtain multiple corneal thickness measurements along a meridian, it is difficult to picture the inherent thickness profile, especially if the differences in measurements are small 7-9. Corneal thickness DATA are customarily reported in thousandths of a millimeter, and small differences can be hard to appreciate by looking at the numbers alone.
A computer program, VOPTIX©, was designed to graphically visualize corneal thickness DATA obtained at multiple corneal locations either along a meridian or collectively for the entire cornea, as well as display and localize the minimal corneal thickness DATA point in any corneal meridian. This program also provides a means to collectively accentuate the differences in corneal thickness in ORDER to more easily visualize the thickness variations. VOPTIX©, however, was not designed to precisely model the cornea. | | | Materials and Methods | Programming and DATA Collection Tools
The complete computer program was written in Borland© C++ version 3.1 for Microsoft® Windows version 3.1 , and was compiled to create VOPTIX©.exe. The program runs on a 386 or greater IBM-compatible personal computer with a math co-processor, under Microsoft® Windows version 3.1.
Data for figures 3 - 6 were collected FROM a normal horse with a 20-mHz ultrasonic pachymeter, Pach-Pen, a device that measures corneal thickness in thousandths of a millimeter. A standard method for judging corneal locations and placement of the pachymetry probe was done visually by the operator using the limbus and the pupil of the eye as a reference 10, 11, 12, 13, 14.
Computer Program Components
Creation of DATA Files
Upon entry INTO VOPTIX©, the program opens INTO a sample DATA file with default settings. The operator can choose to create a new patient DATA file and SELECT the number and location of corneal DATA points, or view a stored patient DATA file.
Entering Measured Data
Under the menu heading, DATA; choices such as ADD Point, REMOVE Point, CHANGE Point, DIMENSIONS, and HEADER are available. ADD Point allows for placement of corneal DATA points. REMOVE Point allows for the removal of corneal DATA points. CHANGE Point allows for the original corneal thickness DATA entry or a change of corneal thickness values. DIMENSIONS allows for the entry of measured corneal width and height, and estimated internal radius of curvature values (arbitrarily declared to be 1/2 of the horizontal corneal diameter). Lastly, HEADER is used for recording the species, ID number, breed, sex, date, and miscellaneous information. Once this information is entered, the schematic of each eye is automatically redrawn accordingly.
Calculating Interpolated Data
Thickness information at locations where no measurement has been taken is obtained by interpolating the measured thickness at neighboring points. The user has control over the number of such locations by changing the grid size setting, FROM 1 to 78 divisions. In addition, the effect of neighboring measured points on an interpolated (calculated) point can be controlled by adjusting the Influence settings FROM 1 to a maximum of 5. An Influence value of 1 indicates that there is little influence FROM neighboring measured points and a value of 5 indicates maximal influence.
An analytical expression was derived to calculate the interpolated corneal thickness (Z) at a given point with two-dimensional coordinates (x, y) and user defined settings for Thick scale, Thick exponent and Influence as follows:
where: (see Formula 1)
The general function of the above expression is to interpolate the corneal thickness at a grid point that does not coincide with a measured point. For a given grid point, the interpolated thickness is calculated as a weighted function of the thickness at all the measured points, where the weight associated with each measured point is inversely proportional to its distance to the grid point. That is, the farther a measured point is FROM the grid point, the smaller the weight factor. In addition, the interpolated values are constrained to be no greater than the measured values.
Viewing of Thickness Profiles
There are three child windows, Data, Cross-Section and Surface figure 1. Placement of the cursor over any window will automatically bring that window to the front. Each window can be minimized to an icon or maximized to fill the screen. At the bottom of the main window a current status of the program settings is always shown and updated.
In the Surface window can either be displayed a two-dimensional diagram of each cornea showing the labeled points where the corneal thickness measurements were made figure 2 or a wire grid diagram.
When the SHOW Grid button figure 2 is depressed, the option of rotating the grid in three dimensions (X, Y or Z), and at any angle combination for each, is available. A graphical view of the collective corneal thickness DATA can be seen in this mode. In addition, if a cross-section has been created, a line is drawn across the surface diagram indicating the cross-sectional meridian. This line will persist in any rotational angle.
When the SHOW Labels button is depressed, a two-dimensional diagram of each cornea with the labeled DATA collection point locations is displayed figure 2. The user can then use the mouse to draw a line along any meridian for one of the corneas, which results in the display of the corneal thickness DATA profile for that selected cross-section of the cornea.
Three settings are available to change the display of the thickness profiles for visual enhancement of the data. The VIEW-SCALE setting allows for zooming in and out in the Cross Section and Surface windows. The THICK-SCALE setting allows scaling the display of thickness measurements, Z values. The THICK-EXPONENT setting allows for variable, non-linear accentuation of the corneal thickness DATA exponentially, which graphically amplifies, or enhances, the differences between the DATA points.
During the display of a cross-section, the point of minimal thickness can be visualized by clicking the SHOW Zero Minimum button. This feature will display the minimal corneal thickness value for that meridian by changing the minimal value to 0 resulting in the contact of the outer and inner cornea lines at the thinnest meridional point.
Help
The Help! button is available at all times to give assistance in explaining the individual functions of the program. | |

Figure 1
Appearance of computer screen upon entering VOPTIX©
|
|
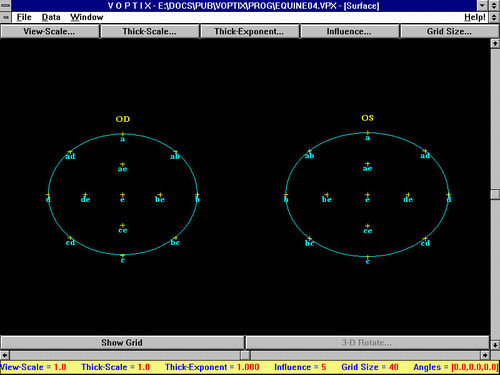
Figure 2
The corneal Surface diagram shows the relative shape of the corneas based on the two corneal dimensions, width and height, and also the location of the measured corneal thickness DATA points. The surface coordinates of each DATA point are based on a 2-axis coordinate system. The origin is at the center of the cornea, point e (0,0). The x axis is along a horizontal line between points b and d, and the y axis is along a vertical line between points a and c.
|
|
Formula 1
"n" is the total number of measured points for the cornea,
"(xi, yi)" are the two-dimensional coordinates of each measured point "i",
"zi" is the measured thickness value at point "i",
"minz" is the smallest thickness value among the "n" points,
"zexp" is the THICK-EXPONENT factor,
"zscale" is the THICK-SCALE factor,
"influence" is the INFLUENCE factor.
|
|
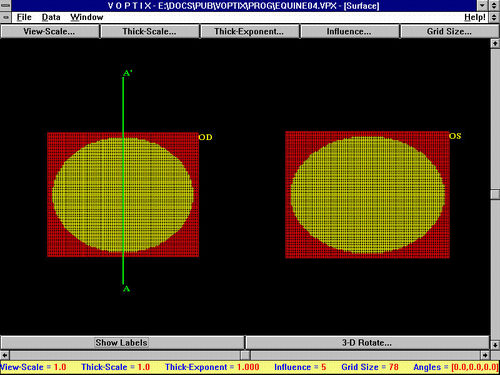
Figure 3
If the Show-Grid button is depressed, a wire grid diagram of both corneas is displayed. If a cross-section had just been imaged, a line representing the meridian selected will be displayed across the wire grid diagram. The label A' is the point where the cross-section line began and label A marks the end of the cross-section line. Orientation of the cross-section can then be appreciated after considering the two labels, as well as whether the cross-sectioned cornea is OD or OS.
|
|

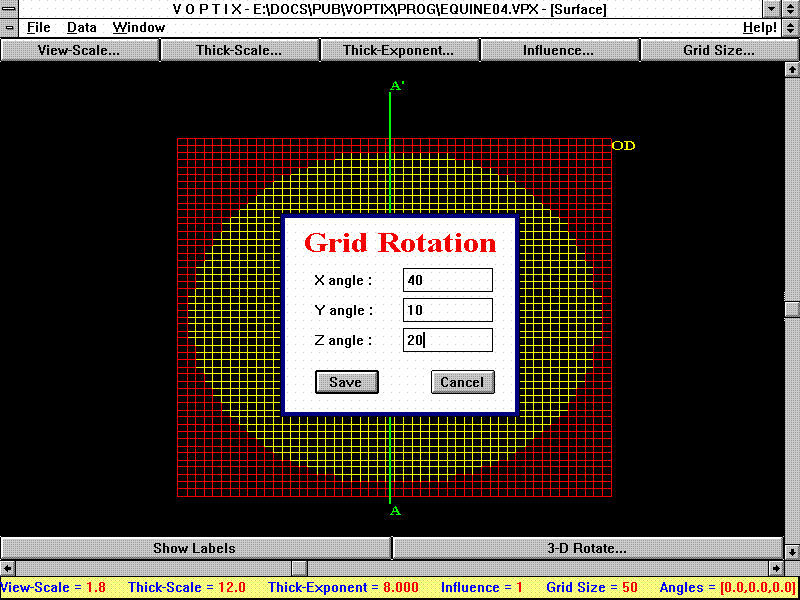
Figure 4a
Figures 4a-4b. Rotation of the cornea diagram in three dimensions can be done by activating the 3D Rotate button and choosing the angles for x, y, and z (figure 4a). This results in a three-dimensional graphical representation of the collective corneal thickness DATA (figure 4b) . The depressed areas are the thinner corneal zones and the raised areas are the thicker corneal zones. Translocation and printing of each image is also possible.
|
|
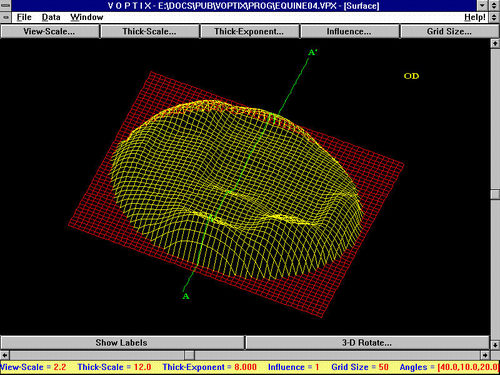
Figure 4b
|
|

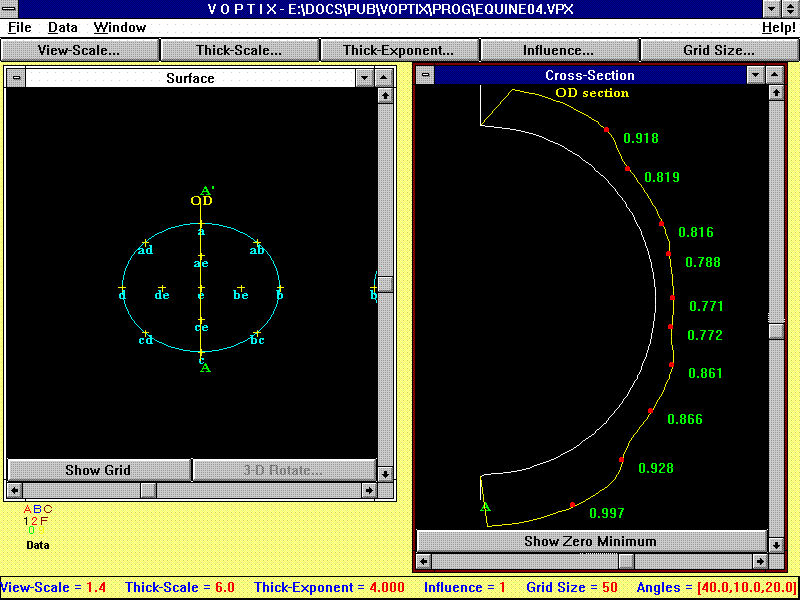
Figure 5
The Cross-Section window displays the meridional cross-section of the cornea which can be viewed in any meridian by drawing a diagonal line with the mouse across the corneal Surface diagram. The results can either be viewed in the Cross-Section window or printed. If the mouse pointer is placed at any point along the surface curve and clicked, the adjacent corneal thickness measurement will be displayed for both measured and interpolated values.
|
|
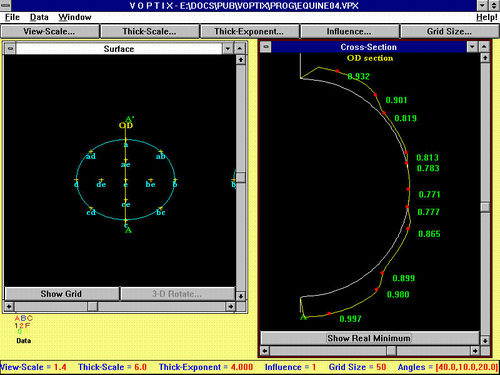
Figure 6
The SHOW Zero Minimum button when activated will move the outer corneal line to meet the inner corneal line to represent the location of the thinnest portion of the cornea along that particular meridian.
|
|
| Discussion | VOPTIX© was designed to help visualize measured corneal thickness DATA in any cross-sectional meridian or as a collective representation of the DATA in a three-dimensional wire grid format and to provide a means for enhancement of thickness differences.
Thickness Interpolation and Representation
For smooth continuity in the representation of the measured data, a mechanism was devised for interpolating the thickness at locations where no measurement had been taken. The idea is based on the assumption that the thickness at a given point is a weighted function of the thicknesses at the measured points, such that the weight factors are inversely proportional to the distances to the measured points. That is, the farther is an interpolated point is FROM a measured point, the smaller the weight factor associated with the measured point. The relation between the weight factors and the distances to the measured points is chosen to be a power function where the exponent is controlled by the user through the THICK-EXPONENT setting.
The true geometry of the cornea is not available when the only DATA known is the horizontal and vertical dimensions of the cornea, the number of corneal thickness measurements, and the horizontal and vertical coordinates of a measured location with respect to the center of the cornea. Because of this, it is not possible to know the true distance between any two points on the surface of the cornea. Since such a distance is necessary in our method to interpolate the thickness at locations where no measurement has been taken, a reference surface must be chosen to perform these calculations. In addition, because the true geometry of the cornea is not available, a reference surface is needed to represent the true overall thickness profile. For simplicity, we will refer to these two reference surfaces as the interpolation surface and the representation surface, respectively.
We chose the interpolation surface to be a two dimensional plane because of the simplicity to calculate the distance between two points (square-root terms in the analytical expression described previously). Any other geometric shape may also be chosen for this surface, but the distance terms in the analytical expression would have to be replaced with the length of the geodesic between two points on the surface, which may be more complex to calculate.
Once all the calculations of the interpolated thickness are performed, the overall thickness profile is represented with reference to an ellipsoid-shaped surface whose three parameters correspond to the horizontal width, the vertical width, and the estimated radius of curvature of the cornea. As described above, this representation surface does not provide a true geometric model of the cornea, but simply allows viewing the thickness DATA in a collective manner.
Enhancement of Thickness Differences
The differences between measured points can be accentuated by increasing or adjusting the values for the View Scale, Thickness Scale, Thickness Exponent, as well as the Influence. Manipulation of the DATA by means of raising the corneal thickness values exponentially, enhances the differences between points and enables the observer to visually appreciate the relative difference between corneal thickness DATA points. Adjusting the Influence setting between 1 to 5 will also enhance the data. For the cases we analyzed, the values above 5 had minimal and diminishing effects. A value of 1 indicates that there is little influence on a particular interpolated point FROM distant measured points and a value of 5 indicates that the distant measured points influence is maximized. In other words, the higher the influence value, the more influence more distant measured points have on a point whose thickness has been interpolated FROM the measured data. If there are few measured corneal DATA points, then perhaps a stronger influence value (e.g. 4 or 5) would be desirable. On the other hand, if there are many measured DATA points, then there is a greater likelihood that only the closer measured points will have an effect on an interpolated point. In this case the influence should be set closer to 1.
Visual localization of each planned measured DATA point position during corneal thickness DATA collection was standard for hand held pachymeters. Visual judgment of corneal position may result in some variance with repeated measures, and therefore affect the interpolated values, however it is argued that this variance is minimal as demonstrated in laboratory animal experiments 5, 13.
In conclusion, VOPTIX© was designed to visualize corneal thickness pachymetric DATA in a graphical format. VOPTIX© was not designed to quantitatively model the actual corneal geometric shape. VOPTIX© primarily serves as a graphical tool for the visualization of the cross-sectional corneal thickness DATA trends, and localization of the minimal corneal thickness DATA point in any meridian. Additionally, VOPTIX© also is capable of presenting a three-dimensional, rotatable, wire grid that is a collective representation of the overall corneal thickness DATA trends for each eye.
VOPTIX© may be especially helpful in the analysis of pachymetry DATA collected during ocular pharmaceutical toxicology trials where monitoring of the endothelial cell function is being done with serial pachymetry. VOPTIX© would also be a helpful tool to use when analyzing corneal thickness DATA FROM patients with corneal endothelial disease where monitoring of corneal thickness trends are important. The authors originally developed VOPTIX© to visualize the normal corneal thickness DATA taken FROM various animal species, for which meager published information is currently available 15. However, any time multiple corneal thickness measurements are collected, VOPTIX© could be used to graphically display the data. | | | Acknowledgements | | This study was supported by a grant FROM the International Business Machines (IBM) Trocos Grant and funding FROM the Department of Surgical Sciences, The School of Veterinary Medicine, University of Wisconsin. | | | References | 1) Samuelson DA. Ophthalmic Embryology and Anatomy. In, Veterinary Ophthalmology. 2nd Ed. K. N. Gelatt. Lea and Febiger. Philadelphia, 1991; 28 - 29.
2) Klyce SD, Beurman RW. Structure and Function of the Cornea. In, The Cornea, Ed. Kaufman HE, Barron BA, McDonald MB and Waltman SR. Churchill Livingstone. New York, 1988; 4.
3) Carrington SD, Woodward EG. The Topography of the Anterior Surface of the Cat's Cornea. Current Eye Research 1984; 31: 823-826.
4) Carrington SD, Woodward EG. Corneal Thickness and Diameter in the Domestic Cat. Ophthal. Physiol. Opt. 1986; 6 (4):385-389.
5) Chan T, Payor S, Holden BA. Corneal Thickness Profiles in Rabbits Using an Ultrasonic Pachometer. Association for Research in Vision and Ophthalmology. 1983; 24: 1408-1410.
6) Morgan RL, Sorenson SS, Castles, TR. Prediction of Ocular Irritation by Corneal Pachymetry. Fd. Chem. Toxic. 1987; 25 (8): 609-613.
7) Ling T. Osmotically Induced Central and Peripheral Corneal Swelling in the Cat. American Journal of Optometry and Physiological Optics. 1987; 64: 674-677.
8) Martola E, Baum JL. Central and Peripheral Corneal Thickness, Arch. Ophthal. 1968;79: 28-30.
9) Remon L, et al. Central and Peripheral Corneal Thickness in Full-term Newborns by Ultrasonic Pachymetry. Investigative Ophthalmology and Visual Science. 1992; 33 (11):3080-3083.
10) Chan T, Payor S, Holden BA. Corneal Thickness Profiles in Rabbits Using an Ultrasonic Pachometer. Association for Research in Vision and Ophthalmology. 1983; 24: 1408 - 1410.
11) Salz JJ, Azen SP, Berstein J, et al. Evaluation and Comparison of Sources of Variability in the Measurement of Corneal Thickness with Ultrasonic and Optical Pachymeters. Ophthalmic Surgery. 1983; 14: 750 - 754.
12) Poincáre. Patient Workup. In, Refractive Eye Surgery. Ed by LD Bores. Boston, Blackwell Scientific Publications. 1993; 120 - 125.
13) Siu A, Herse P. The Effect of Age on Human Corneal Thickness. Statistical Implications of Power Analysis. ACTA-Ophthalmol-Copenh. 1993; 71(1): 51 - 56.
14) Stucchi CA, et al. Systematic Error in Computerized Pachymetry. Ophthalmologica. 1993; 207: 208-214.
15) Schoster JV, Wickman L and Stuhr C. The Use of Ultrasonic Pachymetry and Computer Enhancement to Illustrate the Collective Corneal Thickness Profiles of 25 Cats. Veterinary and Comparative Ophthalmology. 1995; 5(2): 68 - 73. | |
|
|
|
|
|
|
 Welcome, please sign in