|
|
 |
|
|
|
|
|
ERG Measures of Photoreceptor Deactivation in Retinitis Pigmentosa
Digital Journal of Ophthalmology 1999
Volume 5, Number 1
April 1, 1999
|
Printer Friendly
|
|
|
|
|
| Introduction | | Retinitis pigmentosa (RP) refers to a GROUP of inherited retinal dystrophies that are characterized by progressive photoreceptor degeneration. The earliest symptoms in young patients typically involve night blindness; early loss of rod photoreceptor function is a hallmark of this diverse GROUP of diseases [1]. At least 15 RP loci have been mapped to chromosomes and mutations in an ever increasing number of genes have been found to cause disease [2]. Many of these genes code proteins found in rods (rhodopsin, rds/peripherin), but despite the evidence that rod photoreceptor abnormalities are primary in many genetic sub-types of retinitis pigmentosa, much of the focus in human electrophysiology has traditionally been on cones. There are many reasons for this focus. Abnormalities in cone ERG function such as delays in b-wave implicit time discriminate progressive FROM stationary forms of disease, cone visual fields are needed to determine eligibility for disability benefits, and patients themselves are more concerned about failing cone-mediated vision than they are about night blindness. Nevertheless, our focus over the past several years has been on defects in rod function and their relationship to specific gene mutations causing photoreceptor degeneration. This focus necessarily restricts our work to a subset of all patients, and specifically, to those in early stages of disease. An analysis of our database reveals that only 1 in 3 patients age 21 or older retain a detectable rod ERG. The number jumps to over one half (56%) in patients under the age of 21. Thus, by necessity, our focus has been on young patients with retinitis pigmentosa. | | | Discussion | Attempts to relate phenotype to genotype with traditional clinical ERG measures have met with little success, in part because of limitations of outcome parameters. Delays in rod b-wave implicit time and reductions in rod ERG amplitude do not discriminate among genetic types, let alone among specific mutations (Figure 1).
Thus, despite their tremendous value in early diagnosis and in clinical trials, traditional clinical ERG measures are inadequate for developing a mechanistic understanding of genotype-phenotype causal relationships.
The ERG is a mass potential recorded FROM the corneal surface of the eye. The ERG generated by a brief flash includes an initial cornea-negative a-wave, the early portion of which reflects the massed transduction activity of rod and cone photoreceptors [3-6], and the later portion of which reflects inner retinal negative components [7,8]. The a-wave is followed by components that arise FROM post-receptor processes. Among these components is the b-wave, a cornea-positive potential that in the mammalian eye reaches a peak at ~ 60-100 ms after a moderately intense flash and, over a wide range of stimulus conditions, far exceeds the a-wave in absolute peak amplitude [reviewed by 9-11]. Several new developments have vastly increased the value of the ERG as a research tool for studying abnormal rod function in inherited retinal degenerations. Lamb and Pugh recently provided a quantitative description of the activation stages of transduction [12]. We had previously concluded that the leading edge of the human a-wave provides a measure of human rod photoreceptor activity since it could be fitted by traditional receptor models based on n-stage exponential filters [13-15]. More recently, we showed [16] that the Lamb and Pugh model fits the leading edge in normal human subjects slightly better than does the n-stage model. Since the Lamb and Pugh model is based on the actual biochemical steps in the G-protein activation cascade, it can be used to evaluate defects in the activation stages of phototransduction resulting FROM specific gene mutations in RP. An additional advantage of this ERG approach is that it can be readily modified for testing animal models. Thus the same procedures can be used to compare specific transduction defects in patients with defects in, for example, mouse transgenic models with the same mutation [17].
We have developed an efficient protocol for determining transduction parameters for both rods and cones FROM a patient within a short period of time. In earlier work [18], we recorded responses to a series of high-intensity short-wavelength stimuli in the dark followed by a series of photopically-matched long-wavelength stimuli. The long-wavelength stimuli were presented in the presence of a background that was sufficient to eliminate the rod component without substantially light-adapting the cones. By subtracting the cone component, we were able to isolate the rod component. However, to determine cone transduction parameters, we had to obtain a third series of responses to intense long-wavelength stimuli [19]. A more efficient protocol is shown in Figure 2.
We obtain responses in the dark to four white flashes of 3.2, 3.6, 4.0, and 4.4 log scot td-sec (A). These same intensities are presented again in the presence of a background of 3.2 log scot td (B - note scale difference). This background is sufficient to completely eliminate any rod contribution to the response, but does not measurably light-adapt the cones [19]. To CHECK for variations in media transmission, especially in aging patients, we incorporate a long wavelength (W26) flash in the protocol (dashed response). This red flash produces the same cone photoresponse as the 3.6 log td-sec white flash in young subjects, so that any mismatch in a patient due to lens yellowing is readily quantified. To isolate the rod photoresponses, the light-adapted responses are subtracted FROM the dark-adapted responses (C). Based on the Lamb and Pugh [12] quantitative model of the activation steps in phototransduction, the leading edge is defined by:
(1) P3(i,t) @ [1 - exp(-i× S× (t-td)2)] × RmP3 for t > td
where P3 is the sum of the responses of individual rods. The amplitude of P3 is a function of flash intensity, i, and time, t, after flash onset. S is a sensitivity parameter that scales i, RmP3 is the maximum response, and td is a brief delay. Dashed curves in Fig. 2C SHOW the fit of Eq. 1 to the leading edge. Finally, the intensities presented in the presence of the background range FROM 2.85 to 4.0 log phot td-sec (D) and thus are ideal for modeling the cone a-wave (dashed curves). Therefore, with 8 flash intensities, we are able to ANALYZE transduction parameters for both the rod and cone photoreceptors. An additional advantage of this protocol is that it is insensitive to spectral variations in media transmission with aging and does not, as did our previous method, require a precise spectral match between short and long wavelength stimuli to generate rod-only responses.
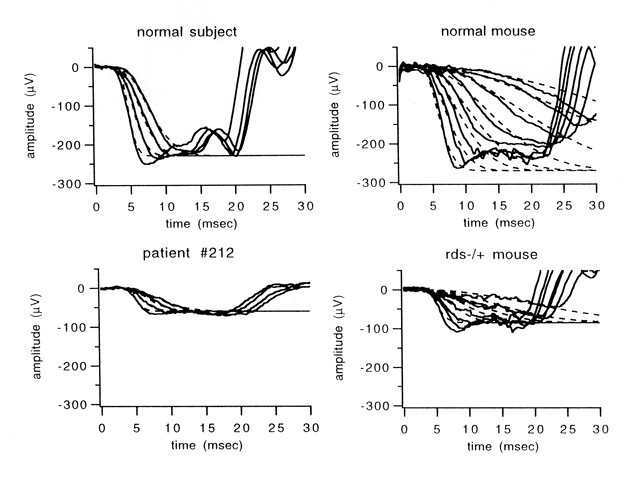
Shown in Figure 3 are rod-only responses FROM a normal subject (top left) and a normal mouse (top right).
Dashed lines in each panel are the fits of Equation 1 to the leading edge of each set of data. Mice SHOW no evidence of cone-mediated a-wave to these intensities of stimuli, so no cone-subtraction procedure is necessary. Note the remarkable similarity in the maximum rod photoreceptor amplitude (RmP3) between human and mouse. Values for the gain parameter (log S) are also in close agreement when expressed in log isomerizations per flash [17]. Also shown in Figure 3 are responses FROM a patient with a splice-site mutation [20] in the RDS gene (lower left) and responses FROM the corresponding mouse model (the rds +/- heterozygote). Both human and mouse have one defective copy of the gene encoding rds/peripherin. Both SHOW progressive photoreceptor degeneration due to haploinsufficiency and both SHOW reduced values of RmP3 but normal values of log S.
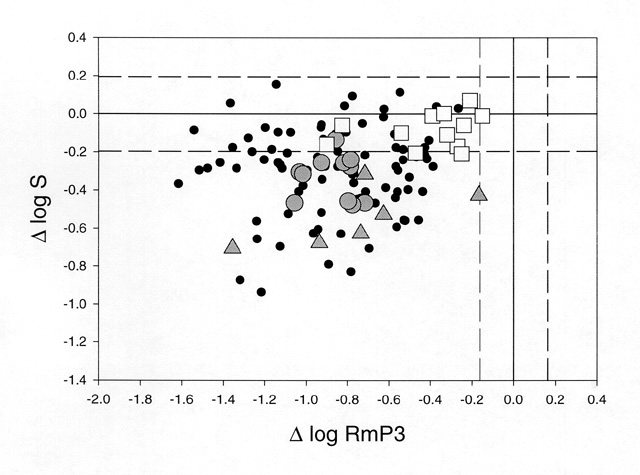
Summary DATA are shown in Fig. 4 for 120 patients with RP. Plotted are the values for log S on the vertical axis against log RmP3 on the horizontal axis. The dashed lines indicate the values within which 90% of normal subjects fall. Virtually all patients SHOW significant reductions in RmP3.
It is highly likely that this decrease is due primarily to a loss of outer segment membrane through loss of receptors and/or a decrease in rod outer segment length. Many patients have values of log S within the normal range, suggesting that this subset of patients has no significant alteration in activation mechanisms of transduction. A sizable number of patients SHOW abnormally low values of log S. This GROUP of patients must have a majority number of rods with an abnormal transduction process in the form of decreased amplification. Also included in Fig 4 are results FROM specific subsets of patients to SHOW some interesting patterns that emerge FROM this kind of analysis. Patients with x-linked retinitis pigmentosa (xlRP) tend to SHOW reduced gain parameters (shaded circles). We have recently shown that xlRP is associated with a decrease in the red blood cell (RBC) membrane content of docosahexaenoic acid (DHA)[21]. The fatty acid composition of RBCs mirrors the content of rod outer segments, suggesting that these patients could have reduced DHA content in the lipid bilayer of the rod and reduced membrane fluidity [22]. Consistent with this possibility, we have recently reported that the gain parameter (log S) is significantly correlated with DHA content in xlRP [23]. Patients with the P23H rhodopsin mutation, (shaded triangles), SHOW a range of values of log RmP3 corresponding to the degree of progression. However, all have significant reductions in log S, suggesting that the mutant rhodopsin decreases the efficiency of initial transduction stages. These results are consistent with localization of the mutant pigment to the outer segment in the transgenic mouse [24] but not with its behavior as a class II mutant in vitro [25]. Open squares represent findings FROM patients with adRP caused by a presumed null mutation in the RDS gene. These patients have reduced values of log RmP3 which again reflects their degree of progression. However, values of log S are within the normal range in all patients, despite some sizable decreases in RmP3. These findings suggest that rds/peripherin plays no role in phototransduction and are consistent with a structural role as a disk rim adhesion protein [17].
The leading edge of the a-wave recorded FROM the human eye spans ~ 5-20 ms. While the leading edge of the rod a-wave is essentially a linear monitor of the rod photocurrent response and can provide activation parameters, it can tell us nothing about photoreceptor inactivation mechanisms. The b-wave and other post-receptor components begin to dominate the human ERG at ~ 10-20 ms and thus obscure the subsequent response of the rods. Photocurrent DATA obtained FROM mammalian rods in vitro [26-30] predict a time scale of several hundred milliseconds or more, depending on flash intensity, for the rod response in vivo. Thus, in the human ERG, the period of development of the leading edge of the rod a-wave represents only a tiny fraction of the duration of the rod flash response. The capability of studying both activation and inactivation stages of transduction in human rods in vivo could have enormous implications for assessing the consequences of specific gene mutations in RP.
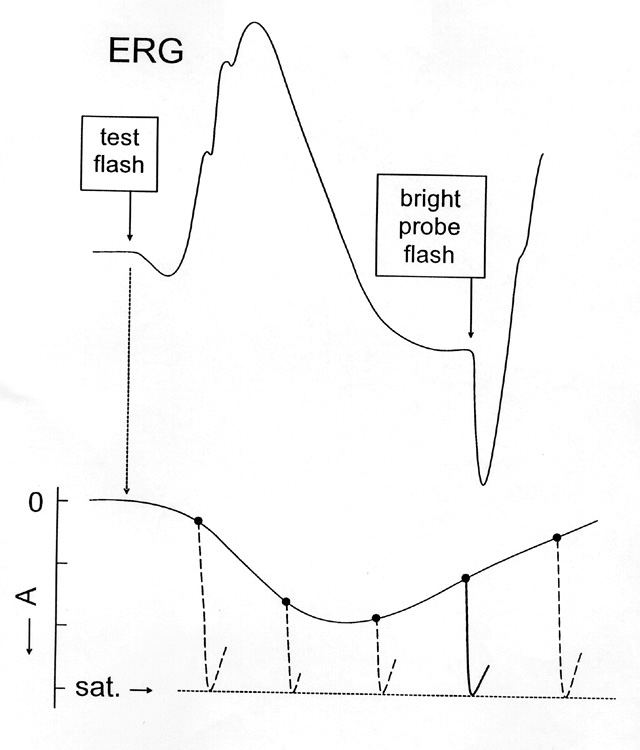
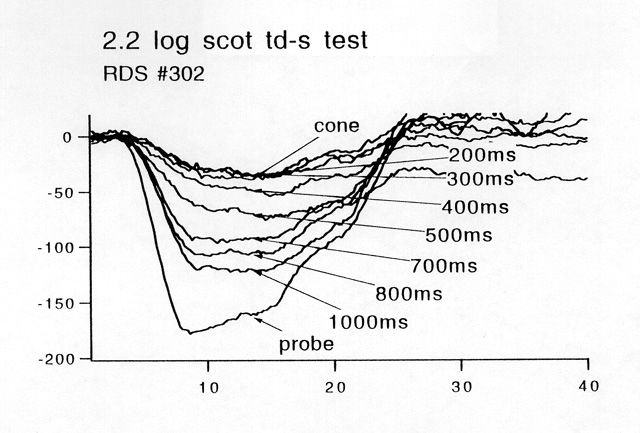
Recently, we established a technique to derive a response that putatively represents the full course of the rod photocurrent response to a weak, i.e., subsaturating, test flash [31]. A bright flash (i.e. 4.2 log scot td-s) produces a complete block of circulating current and maximum excursion of the a-wave in the 10 ms interval preceding b-wave onset. In double-flash experiments (Figure 5), this "probe" flash is presented at time t during the course of the ERG response to a flash presented at time zero ("test" flash).
Subtracting the amplitude to the probe flash at time t FROM the absolute maximum amplitude of the photocurrent response yields the amplitude at time t of the rod response to the test flash. By varying t, the full time course, including recovery kinetics, of the rod photocurrent can be determined. Properties of the derived response FROM the human ERG (time course, sensitivity, adaptation) are comparable to those of in vitro rod photocurrent responses obtained in previous studies [31]. The paired-flash method has also been used in recent studies of the human ERG [31-33] and in similar in vivo studies of the mouse ERG [34,35] to ANALYZE the recovery kinetics of the rod a-wave after a saturating test flash. In this method the extent of recovery FROM rod saturation (i.e., FROM a condition of zero circulating current in the rods) at a given time after the test flash is determined FROM the a-wave response to a bright probe flash that rapidly re-establishes rod saturation. For flashes of increasing intensities above amplitude saturation, there is a progressively delayed onset of the falling (recovery) phase of the response with increasing flash intensity (Figure 6).
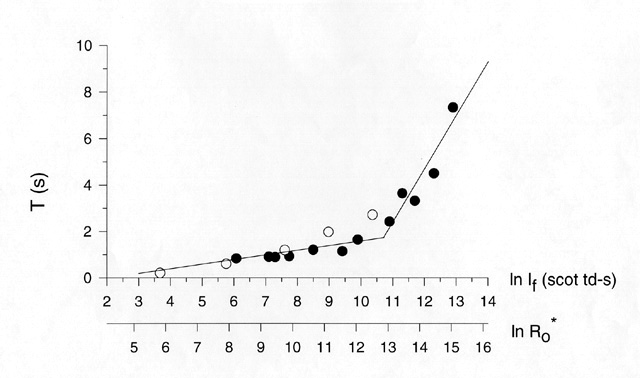
Pepperberg has used a light scattering signal (amplified transient-retina, ATR) to SHOW that the intensity dependence of this delay is regulated by activated enzyme R* produced by the photoisomerization of rhodopsin [36]. Electrophysiological studies in isolated, single rod photoreceptors has provided evidence that the exponential lifetime of R* can be derived FROM the recovery kinetics of the rod photocurrent [37]. We have intensities available in our high-intensity full-field dome that extend several log units above rod a-wave amplitude saturation. We have shown that recovery time varies with intensity over this range [38], to produce a characteristic two-limb "saturation" function (Figure 7).
We have presented a preliminary analysis of this function which suggests that it may be possible to use it to measure inactivation kinetics at several stages within the phototransduction cascade [39]. With this paradigm, we can use the upper branch of the "saturation" function to determine whether specific gene mutations in RP alter the shut-off kinetics of rhodopsin [38], consistent with delayed rod dark adaptation found in adRP patients with T17M, T58A [40] and P23H [41] mutations. We can use the lower branch of the "saturation" function to determine whether mutations in arRP (i.e. PDEb mutations) alter the shut-off kinetics of the transducin-PDE complex. We can investigate adaptation properties of rods in patients by determining how background lights and bleaching alter the kinetics of each branch.
An example of the two-flash method is shown in Figure 8. These DATA were obtained FROM a patient with a presumed "null" mutation in the RDS gene. The response labeled "probe" is the response to the saturation probe flash presented in isolation. The time (t) between the test flash and the probe is indicated for the remaining responses. For values of t less than approx. 400 ms, the response to the probe flash consists of only a cone response. As t increases, so too does the amplitude of the response to the probe.
We may define A(t) as the amplitude at time t of the rod response to the test flash. We may similarly define Am(t) as the maximum further reduction in rod circulating current at time t, i.e., the reduction that at time t produces zero circulating current and thus saturates the rod response. If the amplitude of the test flash-generated ERG is itself changing only gradually at time t, the peak amplitude of the rapidly-developing rod response to the probe flash is expected to represent Am(t). A(t), the amplitude at time t of the rod response to the test flash, should then be given by
(2) A(t) = Amo - Am(t)
where Amo, the absolute maximum amplitude of the photocurrent response, is the peak amplitude generated by the probe flash alone (i.e., in the absence of a recent test flash). The family of amplitudes obtained by varying the interval t between the test and probe flashes should, in turn, approximate the recovery of the rod response to the test flash.
The DATA FROM Figure 8 are plotted as a recovery function in Figure 9A. The solid curve is a best-fit exponential recovery function. T (349 ms in this patient) is the derived period of complete suppression (i.e. the time during which the probe elicits no rod response). The dashed curve represents similar DATA for a normal subject. It appears FROM this comparison (and similar DATA FROM other patients with this mutation) that inactivation kinetics, like activation behavior, are indistinguishable FROM normal in patients with RDS "null" mutations. Figure 9B shows that the identical analysis can be obtained FROM the corresponding mouse model. The solid symbols are recovery DATA FROM a rds+/- mouse. Both the time constant of recovery and the period of complete suppression (T) are indistinguishable FROM those in the normal mouse (dashed curve).
In conclusion, there has been a resurgence of activity in electroretinography due primarily to a new synthesis between clinical techniques and traditional single-unit approaches. By developing methods for isolating rod and cone a-waves FROM patients over a large range of retinal illuminances, it has become possible to design experiments that probe stages in the phototransduction process in RP. This mechanistic use of the ERG has elevated the search for phenotype/genotype relationships to a new level and is being pursued vigorously in a number of laboratories. Work to date has identified abnormally low values for the gain parameter (log S) in patients with xlRP and in adRP caused by the P23H rhodopsin mutation. To study transduction beyond the initial gain stage of human rods in vivo it is desirable to derive, FROM ERG data, the full time course of the rod flash response including recovery. Results FROM patients with an RDS "null" mutation, as well as parallel findings in the rds+/- mouse, suggest that both activation and inactivation mechanisms are indistinguishable FROM normal, despite sizable reductions in the maximal photoreceptor response (RmP3). This is consistent with the proposed role of rds/peripherin as member of a new class of adhesion proteins that stabilize the rim of outer segment discs. It has been proposed [17] that there is a critical reduction in rds/peripherin, which shortens the disc-rim path without changing the disc membrane area. The result is a greatly reduced number of discs and the production of very large discs that assume whorl or jelly-roll shapes. Nevertheless, transduction parameters can remain normal despite the massive disruptions in structure that are evident in the histology. | |
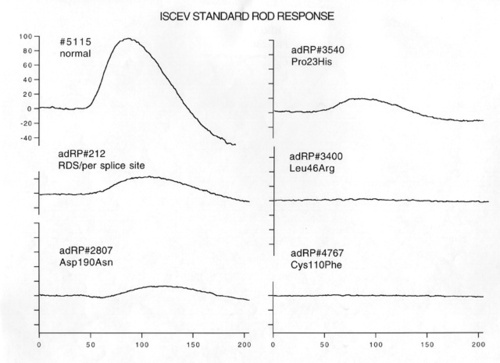
Figure 1
ISCEV standard [42] rod ERG responses in a normal subject, a patient with an RDS splice site mutation, and 4 patients with adRP due to different rhodopsin mutations.
|
|
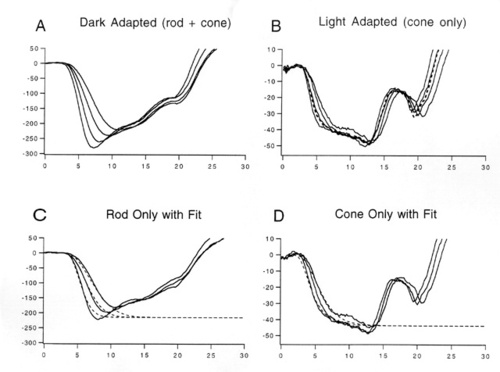
Figure 2
White flash protocol for isolating rod-only and cone-only photoresponses. A. Averaged responses n=3) FROM the fully dark-adapted eye to white stimuli ranging FROM 3.2 to 4.4 log scot td-sec. B. Responses to the same stimuli as in A but in the presence of a 30 cd/m2 background. In photopic units, these flashes range FROM 2.85 to 4.0 log phot td-sec. The dashed curve is the response to a long-wavelength (W26) stimulus of 3.65 log phot td-sec. In young subjects, this stimulus produces an identical response to that of the second highest white stimulus. Lens yellowing in the elderly can readily be detected by a mismatch in the responses. C. Rod-only responses produced by subtracting responses in B FROM responses in A. Dashed curves are the fit of Eq. 1 to the data. D. Cone-only responses FROM B can readily be fit by a modified version of the Lamb and Pugh model [19].
|
|

Figure 3
Rod-only responses and best-fits of Eq. 1 (dashed curves) in a normal subject (top left), patient #212 with an RDS "null" mutation (bottom left), a normal mouse (top right), and an rds+/- mouse (bottom right).
|
|

Figure 4
Reductions in log RmP3 and log S (relative to the mean of 25 normal subjects) are plotted relative to each other for 120 patients with retinitis pigmentosa. Shaded circles: xlRP; shaded triangles: P23H rhodopsin mutations; open squares: RDS splice site ("null") mutations. The area between the dashed lines includes 90% of the normal population.
|
|

Figure 5
Cartoon representation of the two-flash paradigm. The top curve is the ERG to a test flash. The underlying rod photoresponse is indicated below. A bright probe flash delivered at time (t) following the test flash reestablishes a condition of complete saturation. The amplitude of the response to the probe indicates the distance FROM saturation at time t and "traces out" the underlying photoresponse to the test flash.
|
|
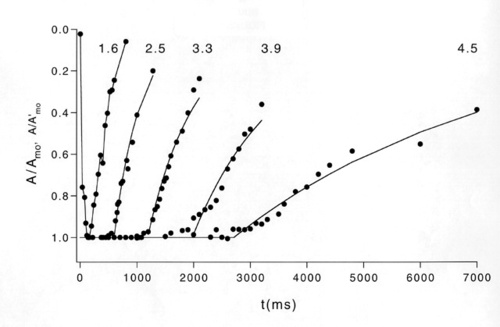
Figure 6
Recovery functions in a normal subject to a just-saturating test flash of 1.6 log scot td-sec and a series of test flashes of increasing intensity. The period of complete suppression (T) grows with increasing intensity.
|
|

Figure 7
Two-limb "saturation function (T versus ln If function) for rod-only a-wave in a normal human subject. Filled circles: DATA reported by Birch et al. [38]; open circles: DATA FROM lower branch reported by Pepperberg et al. [39]. The period of complete suppression (T) is plotted against the natural log of test flash intensity (the bottom scale shows log isomerizations per flash). The slope of the lower limb is approx. 300 ms, while the slope of the upper limb is approx. 2.3 sec.
|
|

Figure 8
Raw recovery DATA FROM a patient with an RDS "null" mutation. At times t less than 400 ms after the test flash, there is only a cone response to the probe. The amplitude of the rod response to the probe grows over the next several hundred ms until it approximates the response to the probe presented alone ("probe").
|
|

Figure 9
Relative amplitude of rod photoresponse during recovery phase. A. Patient with RDS "null" mutation (solid symbols) compared to normal subject (dashed curve). Solid curve is exponential recovery function with a period of complete suppression (T) of 349 ms. B. Similar DATA FROM an rds+/- heterozygote mouse (solid circles) compared to a normal mouse (dashed curve). Solid curve is exponential recovery function with a period of complete suppression (T) of 189 ms.
|
|
| References | 1. Heckenlively JR. Retinitis Pigmentosa. . Philadelphia: J.B. Lippincott Co.; 1986.
2. Daiger SP, Sullivan LS, Rodriguez JA. Correlation of phenotype with genotype in inherited retinal degeneration. Behavioral and Brain Sciences. 1995;18:452-467.
3. Brown KT, Wiesel TN. Localization of origins of electroretinogram components by intraretinal recording in the intact cat eye. Journal of Physiology. 1961;158:257-280.
4. Penn RD, Hagins WA. Signal transmission along retinal rods and the origin of the electroretinographic a-wave. Nature. 1969;223:201-205.
5. Sillman AJ, Ito H, Tomita T. Studies on the mass receptor potential of the isolated frog retina. I. General properties of the response. Vision Research. 1969;9:1435-1442.
6. Heynen H, van Norren D. Origin of the electroretinogram in the intact macaque eye. I. Principal component analysis. Vision Research. 1985;25:697-707.
7. Steinberg RH, Frishman LJ, Sieving PA. Negative components of the electroretinogram FROM proximal retina and photoreceptor. In: Osborne N, Chader G, eds. Progress in Retinal Research. New York: Pergamon; 1991:121-160.
8. Robson JG, Frishman LJ. Photoreceptor and bipolar cell contributions to the cat electroretinogram; a kinetic model of the early part of the flash response. J. Opt. Soc. A. 1996;13:613-622.
9. Dowling JE. . The Retina: An Approachable Part of the Brain. Cambridge, MA: Belknap Press of Harvard University; 1987:164-186.
10. Steinberg RH, Frishman LJ, Sieving PA. Negative components of the electroretinogram FROM proximal retina and photoreceptor. In: Osborne NN, Chader GJ, eds. Progress in Retinal Research. Oxford: Pergamon; 1991:121-160.
11. Ogden TE. Clinical electroretinography. In: Ryan SJ, ed. Retina. Second ed. St. Louis: Mosby; 1994:321-332.
12. Lamb TD, Pugh EN. A quantitative account of the activation steps involved in phototransduction in amphibian photoreceptors. J. Physiol. 1992;499:719.
13. Hood DC, Birch DG. The a-wave of the human electroretinogram and rod receptor function. Investigative Ophthalmology and Visual Sciences. 1990a;31:2070-2081.
14. Hood DC, Birch DG. A quantitative measure of the electrical activity of human rod photoreceptors using electroretinography. Visual Neuroscience. 1990b;5:379-387.
15. Hood DC, Birch DG. The relationship between models of receptor activity and the a-wave of the human ERG. Clin. Vis. Sci. 1990c;5:293.
16. Hood DC, Birch DG. Light adaptation of human rod receptors: the leading edge of the human a-wave and models of rod receptor activity. Vision Res. 1993;33:1605-18.
17. Kedzierski W, Lloyd M, Birch DG, Bok D, Travis GH. Generation and Analysis of Transgenic Mice Expressing P216L-Substituted Rds/peripherin in Rod Photoreceptors. Invest. Ophthal. Vis. Sci. 1997;38:498-509.
18. Hood DC, Birch DG. Rod phototransduction in retinitis pigmentosa: estimation and interpretation of parameters derived FROM the rod a-wave. Invest Ophthalmol Vis Sci. 1994;35:2948-61.
19. Hood DC, Birch DG. Phototransduction in human cones measured using the a-wave of the ERG. Vision Research. 1996;35:2801-2810.
20. Sullivan LS, Guilford SR, Birch DG, Daiger SP. A novel splice site mutation in the gene for peripherin/RDS causing dominant retinal degeneration. Invest. Ophthalmol. Vis. Sci. 1996;37:5235.
21. Hoffman DR, Birch DG. Docosahexaenoic acid in red blood cells of patients with X-linked retinitis pigmentosa. Invest Ophthalmol Vis Sci. 1995;36:1009-18.
22. Treen M, Hoffman DR, Jameson DM, Thomas VL, Uauy RD. Effect of docosahexaenoic acid on membrane fluidity and function in intact cultured Y-79 retinoblastoma cells. Archives of Biochemistry and Biophysics. 1992;294:564-570.
23. Hoffman DR, Wheaton DH, Locke K, Birch DG. Rod ERG function and erythrocyte docosahexaenoic (DHA) in x-linked retinitis pigmentosa (xlRP). Invest. Ophthalmol. Vis. Sci. 1997;38:797.
24. Olsson JE, Gordon JW, Pawlyk BSea. Transgenic mice with a rhodopsin mutation (Pro23His): A mouse model of autosomal dominant retinitis. Neuron. 1992;9:815-830.
25. Sung C-H, Schneider BG, Agarwal N, Papermaster DS, Nathans J. Functional heterogeneity of mutant rhodopsins responsible for autosomal dominant retinitis pigmentosa. Proc. Natl. Acad. Sci. USA. 1991;88:8840-8844.
26. Baylor DA, Nunn BJ, Schnapf JL. The photocurrent, noise and spectral sensitivity of rods of the monkey. Macaca fascicularis. Journal of Physiology. 1984;357: 575-607.
27. Tamura T, Nakatani K, Yau K-W. Light adaptation in cat retinal rods. Science. 1989;245:755-758.
28. Nakatani K, Tamura T, Yau K-W. Light adaptation in retinal rods of the rabbit and two other nonprimate mammals. Journal of General Physiology. 1991;97:413-435.
29. Kraft TW, Schneeweis DM, Schnapf JL. Visual transduction in human rod photoreceptors. Journal of Physiology. 1993;464:747-765.
30. Chen J, Makino CL, Peachey NS, Baylor DA, Simon MI. Mechanisms of rhodopsin inactivation in vivo as revealed by a COOH-terminal truncation mutant. Science. 1995;267:374-377.
31. Pepperberg DR, Birch DG, Hood DC. Photoresponses of human rods in vivo derived FROM paired-flash electroretinograms. Visual Neuroscience. 1997;14:73-82.
32. Birch DG, Pepperberg DR, Hood DC. The effects of light adaptation on recovery kinetics of the human rod photoresponse. Vision Science and Its Applications; OSA Technical Digest Series. 1996;1:60-63.
33. Birch DG, Pepperberg DC, Hood DC. Recovery of dark- and light-adapted flash responses of human rods and cones. Invest. Ophthalmol. Vis. Sci. 1996;37:3733.
34. Lyubarsky AL, Pugh EN. Recovery phase of the murine rod photoresponse reconstructed FROM electroretinographic recordings. J. Neuroscience. 1996;16:563-571.
35. Goto Y, Peachey NS, Ziroli NE, et al. Rod phototransduction in transgenic mice expressing a mutant opsin gene. J. Opt. Soc. Am. A. 1996;13:577-585.
36. Pepperberg DR, Kahlert M, Krause A, Hofmann KP. Photic modulation of a highly sensitive, near-intrared light-scattering signal recorded FROM intact retinal photoreceptors. Proc. Nat. Acad. Sci. 1988;85:5531.
37. Pepperberg DR, Cornwall MC, Kahlert M, et al. Light-dependent delay in the falling phase of the retinal rod response. Visual Neuroscience. 1992;8:9-18.
38. Birch DG, Hood DC, Nusinowitz S, Pepperberg DR. Abnormal activation and inactivation mechanisms of rod transduction in patients with autosomal dominant retinitis pigmentosa and the pro-23-his mutation. Invest Ophthalmol Vis Sci. 1995;36:1603-14.
39. Pepperberg DR, Birch DG, Hofmann KP, Hood DC. Recovery kinetics of human rod phototransduction inferred FROM the two-branched a-wave "saturation" function. J. Opt. Soc. Am. 1996;13:586-600.
40. Jacobson SG, Kemp CM, Sung C-H, Nathans J. Retinal function and rhodopsin levels in autosomal dominant retinitis pigmentosa with rhodopsin mutations. American Journal of Ophthalmology. 1991;112:256-271.
41. Kemp CM, Jacobson SG, Roman AJ, Sung CH, Nathans J. Abnormal dark adaptation in autosomal dominant retinitis pigmentosa with proline-23-histidine rhodopsin mutation. Am. J. Ophthalmol. 1992;113:165-174.
42. Marmor MF, Arden GB, Nilsson SEG, Zrenner E. Standard for clinical electroretinography. Arch. Ophthalmol. 1989;107:816-819. | |
|
|
|
|
|
|
 Welcome, please sign in