|
|
 |
|
|
|
|
|
Selective Rod- and Cone-ERG Responses in Retinal Degenerations
Digital Journal of Ophthalmology 1998
Volume 4, Number 10
December 20, 1998
|
Printer Friendly
|
|
|
|
|
| Abstract | Keywords
electroretinogram, Ganzfeld, rods, cones, tapetoretinal degeneration, anesthesia | | | Introduction | In the wiring of the vertebrate retina and in its function, the rod- and cone-system are regarded as two separate entities within one anatomical structure [1], that are able to function separately or to interact, depending on the adaptational state. "Scotopic" function can be misunderstood as synonymous with rod function, since intense stimulation applied in the dark-adapted state obviously will elicit cone activity as well. The mesopic range, in the broad sense, is defined as visual function in the presence of low intensity background illumination involving rod- and cone-activity. Photopic vision addresses primarily cone function in the presence of a rod-desensitizing background, although underlying rod receptor potentials have also been detected in the photopic electroretinogram (ERG) [2].
Evidently, the two photoreceptor-systems can be affected selectively or together, in a remarkably variable proportion in a wide spectrum of disorders. The pathophysiology of these phenotypically variable conditions determine the patients individual problems. Therefore it is meaningful to assess the specific functional impairments in detail. Upon photic stimulation, the rod- and the cone-systems of the vertebrate retinas generate characteristic mass potentials that are recordable as the ERG FROM the cornea. I shall briefly describe this non-invasive diagnostic method, refer to the principle employing rod- and cone-matched color filters for stimulation and illustrate selected examples. The article concludes with a TABLE that lists decisions that are facilitated by and frequently involve ERG testing and interpretation in the context of the clinical exams, in particular the features of the fundus and the visual fields. | | | Results | Correlation between impairment of visual fields and ERG
Recently, different patterns of progression of visual field loss in RP and in Usher syndrome type II have been presented [38]. The authors were able to distinguish, based on at least 3 serial Goldmann type visual field recordings, between 4 types: incomplete peripheral ring scotomas, pericentral scotomas, concentric loss of field area, and superior altitudinal loss. These types of field deterioration were not related to the genetic type of RP. The correlation between defects in the visual field and abnormality of the ERG pattern is inconsistent in a large proportion of patients presenting with tapetoretinal degenerations [39]. We encounter, not infrequently, patients that follow their regular professional activities presenting with a non-recordable ERG. A remarkable number of patients afflicted with RP or choroideremia maintain occupational, professional and driving activity with peripheral and central islands of the visual field or extensive midperipheral ring scotomas, but htey reveal non-recordable ERGs. I suggest the following explanations: excellent adaptation to reduced sensitivity as well as area in the visual field, convergence of the remaining photoreceptors to second ORDER neurons and ganglion cells and optimal integration of the residual activity within the retina. These changes in retinal structure appear to be accompanied by a proportionally faster decay of the generators of the ERG b-wave.
Figure 4 again compares a normal ERG to the gestalt of ERGs in three typical conditions. Panel B depicts a case of cone-rod degeneration, an entity that was referred to as RP inversa by Franceschetti. The differentiation FROM progressive cone-dystrophy can be difficult before the rod ERG is clearly affected. Panel C depicts a flecked retina entity, fundus albipunctatus. This patient reached the normal rod threshold in Goldmann Weekers dark adaptometry only after 130 min. Panel D shows a patient FROM a family affected with Malattia leventinese, identical with dominantly inherited drusen of the posterior pole.
Typically these patients present with mild ERG changes [40,41]. In contrast, this patient referred for documentation of an advanced stage of the disease with major atrophic changes at the entire posterior pole, presented with drastic reduction in the b-wave amplitudes of both, the cone- and the rod-ERG and with increased implicit time Of the cone b-wave.
In a larger format, a discussion of rod- and cone-ERGs should comprise isolate vs. syndromic phenotypes of RP, phenocopies of RP, particularly due to postinflammatory, toxic or vitamin A deficient conditions, ERG in carriers of X-linked RP [42] and choroideremia, and toxic impairment of retinal function. Obviously extensive bibliography and discussion would be required to complete the present brief article. TABLE I lists a few conditions with normal ophthalmoscopic features where the rod-/cone-ERG can facilitate the differential diagnoses. | | | Discussion | Generation of the ERG
Photoreceptors of the verteberate retina are depolarized in the dark and respond to increase in illumination with intensity-related graded hyperpolarization. The majority of the neurons of the inner nuclear layer respond to light of different intensity as well with graded changes in the membrane potential. The retinal image of the visual world is thus transformed through a highly complex network of specialized neurons, INTO pulse-coded information as firing patterns in retinal ganglion cells. Signal propagation in ON- and OFF-channels, the separation of rod- FROM cone-channels as well as common use by cone bipolar cells, and spatial and temporal modulation are some of the tasks of specific retinal circuits. All signals appear to give rise to transient or to sustained changes in the extracellular ion composition. The major changes are seen in the concentration of K+, varying in polarity and extent with retinal depth. In addition, the conductivity for K+ changes along the surface of the Müller cell, resulting in localized K+ buffering resulting in a radial current. Light-evoked changes in extracellular [K+] in the subretinal space, in the outer and inner plexiforme layers give rise to sustained or transient changes in the radial current along the Müller cell. These changes were found to be the site of generation of some of the components of the electroretinogram (ERG). At least in amphibian retina, the responses of the Müller cell to these changes in K+ have been shown to be responsible for the generation of the b-wave of the electroretinogram, driven by a transient increase in extracellular K+ originating FROM depolarizing (ON) bipolar cells and regionally restricted to the outer plexiforme layer. Contributions FROM ON- and OFF-bipolar cells were separated pharmacologically by Sieving et al. [3] in the primate retina. This study yielded evidence for contributions to the normal ERG b-wave FROM both, the depolarizing ON- and FROM the hyperpolarizing OFF-second ORDER neurons.
Light-evoked excitation and inhibition of the retinal network induce changes in the concentrations of K+, Na+ and Cl- , that give rise to multiple field potentials[4]. The field potentials are passively propagated as transient fast and slow electrical changes through the volume conductors of the vitreous, lens, aqueous humor and cornea. Extensive experimental work FROM many laboratories, comprising anatomical studies and recording light-evoked signals intaretinally and often intracellulary by means of electrolyte-filled glass microelectrodes, has determined the sites of origin of the various ERG components. Clinically the EOG and the ERG are recorded FROM the cornea and skin, respectively. Electrodes, DC recording or AC filtering, and if necessary signal averaging are used according to the particular light-evoked potentials under study. The stimulus is selected in intensity, wavelength, geometry, pattern, duration and frequency according to the investigators question. Dark- and light-adaptation favor or desensitize the rod-photoreceptor system. The major light-evoked signals FROM retinal pigment epithelium and retina are: fast and slow oscillation of the standing potential, referred to as the electrooculogram (EOG), a-wave and the late recptor potential (fast and slow P III) of the ERG, b-wave of the ERG, c-wave of the ERG, scotopic threshold response (STR), and the pattern ERG.
Figure 1 illustrates schematically the approximate site of generation of light-induced electrical field potentials with the simplified structure of the retina: The c-wave of the DC-ERG follows the a- and b-waves and reflects the balance between the positive response of the retinal pigment epithelium (RPE) and a negative response of the Müller cells to the light-evoked decrease in K+ ions in the subretinal space[5]. The slow time course of the c-wave (several seconds) appears to preclude its routine recording in patients. The standing potential across the RPE responds to step increases in full field illumination with a fast and a slow oscillation (light peak), recorded clinically as the electrooculogram (EOG).
In the ERG, a cornea-negative a-wave, preceding the positive b-wave, reflects the mass activity of the photoreceptors and can be related to photransduction by assessing changes in its slope [6].The b-wave, generated in the "middle" retina reflects the activity of second ORDER neurons and most likely its effects on the Müller (glia) cells. Oscillatory potentials, superimposed on the rising phase of the b-wave, originate in the inner part of the inner nuclear layer, most likely FROM amacrine cells at stimulus intensities that elicit responses FROM the rod-and FROM the cone-system. Below the threshold of the b-wave, the negative scotopic threshold response (STR[7]) is generated in the inner retina and proved useful in detecting rod function at threshold in patients as well as in experimental animals. The pattern ERG is an inner retinal response of very low amplitude that carries luminance as well as spatial components [8].
Rod- and cone-driven ERGs as a noninvasive clinical test
The rod- and cone-system differ not only in structure ([9], chapter 5 in [1]), retinal circuitry, and range of sensitivity to light but also in their metabolic requirements [10,11]and in pharmacological responses, as documented in experimental studies[12-14]. Clinically, however, the involvement of one of the systems or both has to be assessed by electroretinography to diagnose congenital or degenerative diseases. It appears that reliable control over the adaptational state of the patient (20 min. dark adaptation, and at least 8 min light adaptation to record stable cone-system-ERGs[15]) are essential prerequisites, as expressed in the ISCEV standard [15] and carried out in most ERG laboratories following a similar routine. We have adopted the method introduced by Gouras[16-18] of rod-matched responses to a short and then to a long wavelengths flash, and to white flash-induced mixed rod-cone response in dark adaptation, followed by recording matched cone responses and 30 Hz white flicker signals in presence of a white, rod-desensitizing background[19-21].
We use Henkes low vacuum contact lens electrodes (black, providing an artificial pupil), Beckman EEG skin electrodes above each eye as reference, and a Grass AgAgCl electrode on one earlobe as ground. Conventional preamplifiers, oscilloscope and polaroid photography FROM the oscilloscope screen or X-Y recording allow sensible observation of original traces and direct detection of artifacts (Figure 2, left column and Figure 4A). Signal averaging, employed when needed, increases resolution and allows detection of small residual ERGs i.e. in advanced stages of tapetoretinal degenerations. However, biological, photovoltaic or inductive artifacts can inadvertedly contaminate the result. - Patient DATA are compared to reference-ERG DATA recorded in healthy volunteers [15]. Normal ERGs (Figure 2, left column and Figure 4A) illustrate our routine sequence of recordings, closely related to the ISCEV standard [22]. Light adaptation with a rod-desensitizing background for at least 8 min is necessary for reproducible evaluation of the cone ERG [15,23]. Flicker (30Hz) responses are reported to allow detection of sub-microvolt amplitudes in advanced stages of retinal degenerations[24] as well as in achromatopsia [25]. Interpretation of ERG DATA is bound to comparison with mean ± two standard deviations FROM healthy subjects (optimally of the same age group) in a given laboratory [15,26].
It should be borne in mind that the range of low-normal b-wave amplitudes represents a gray zone, in which we hardly can exclude the beginning of a disease process such as a tapetoretinal degeneration: the loss of RPE cells and photoreceptors can occur while the electrical light-evoked mass potentials are within the normal range.
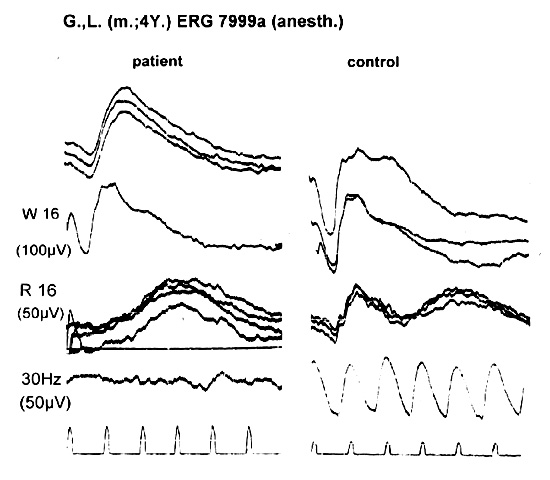
General anesthesia on an outpatient basis for ERG recording in combination with detailed ophthalmoscopy and fundus photography has been useful for early diagnosis in infants and children under 5 years[27,28], an normal example of which is shown in Figure 5 (right column).
To keep the duration of the anesthesia short, an abbreviated and more qualitative ERG procedure is used, involving moderate as well as intense white stimulation after dark adaptation for several minutes and then stimulation via a broad band long wavelengths filter for qualitative presentation of rod- and cone-ERGs in the same trace.
While suspected impairment of vision in newborns and infants in general calls for ERG testing, the diagnoses of achromatopsia, of CSNB, of very early onset RP and of Leberís congenital amaurosis come to mind. Congenital amaurosis Leber comprises absent or highly reduced ERG, blindness or grossly reduced vision, hypermetropia, nystagmus, digito-ocular sign of Franceschetti, frequent development of keratoconus, and in a fraction of patients also mental retardation. The pathophysiology appears to be either impaired photoreceptors at birth or a very early dystrophy. The early-on ERG testing can lay the ground for adequate support, training and education of the infant. For the same reason it is important to assess early-on a combined visual and hearing loss in Usherís syndrome.
These ERG procedures are also applied, modified and complemented to assess retinal function in experimental animals, particularly in models of retinal degeneration, in gene knockout-, and in transgenic animals, as expertly addressed by fellow contributors within this symposium. The method to apply rod- matched and cone-matched filters for stimulation has to be adjusted for the visual pigments of the animal under investigation.
Rod- and cone-ERGs in selected retinal disorders
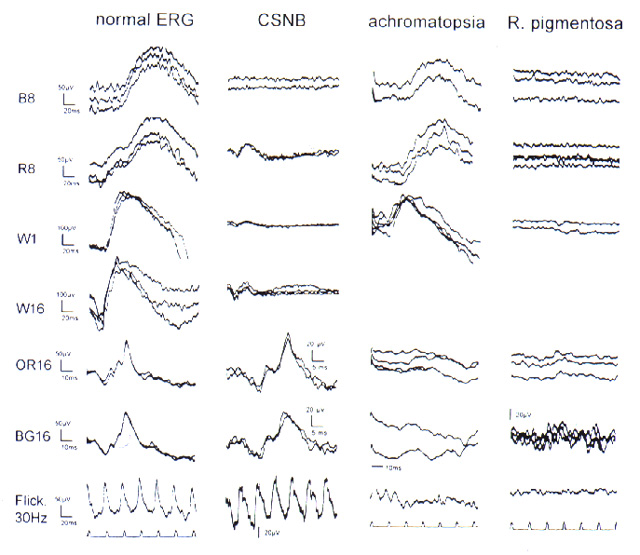
Figure 2 gives an overview of a normal ERG pattern in comparison to 3 examples of retinal dysfunction. The ERG in congenital stationary night blindness, shown in Figure 2, can present with the ERG pattern presented here or it can reveal large and long negative responses upon intense stimulation in dark adaptation (Schubert-Bornschein type), chapter 97 in[1]. Dark adaptation measurements reveal absent or markedly elevated rod thresholds [29].
Achromatopsia [30,31] (Figure 2, 3rd column) in most instances characterized by photophobia, visual acuity of 0.1 or lower (improving upon reducing the level of illumination), nystagmus, is an autosomal recessive disorder, but an incomplete form may be X-linked recessive. The ERG reveals normal rod-mediated, but highly reduced cone-mediated ERGs and virtually absent 30 Hz flicker responses. Early diagnosis by ERG testing in general anesthesia is illustrated in Figure 5, with the abbreviated ERG protocol described above.
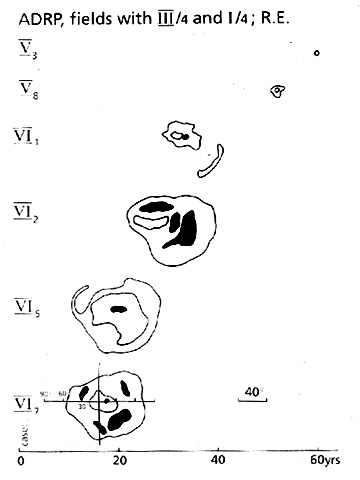
The right column of Figure 2 shows one of numerous possible ERG patterns in retinitis pigmentosa (RP) with only residual cone-mediated activity and absent rod-mediated ERGs. In our view, all RP patients reveal at least one abnormality in the ERG pattern used here. Increased implicit time in the cone b-wave often precedes a decrease in amplitude [32]. RP can, as observerd in relatively few families, follow a predictable pattern and rate of progression (ADRP). The typical changes in a family affected over 6 generations with autosomal dominant RP due to a Pro 347 Arg mutation [33,34]are shown in Figure 3. The ERG reveals already at age 18-20 years minimal residual signals FROM the cone system, without any detectable rod ERGs[34]. It is well known that RP presents with remarkable phenotypic diversity in relation to the genetic heterogeneity [35-37].The spectrum of genetic aspects of retinal degenerations is addressed by distinguished contributors to this symposium. | |
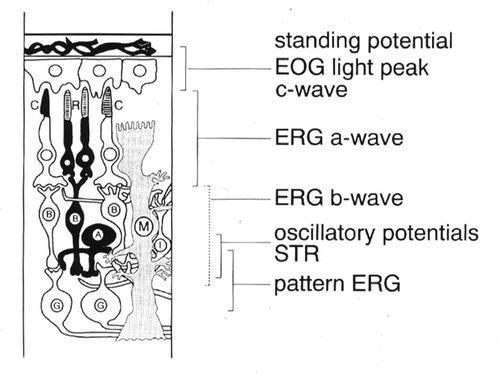
Figure 1
Simplified scheme of the vertebrate retina with the approximate sites of generation of electrophysiological signals. A, amacrine cells; B, bipolar cells; C, cone photoreceptors; G, ganglion cells, I, interplexiforme cells, M., Müller (glial) cells; R, rod photoreceptors.
|
|
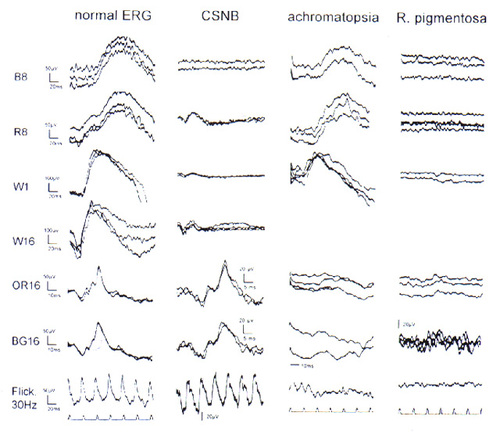
Figure 2
Rod- and cone single flash electroretinograms of a healthy adult and of 3 typical retinal conditions. Adjacent to the left column intensity settings of a Grass strobe, mounted in a Ganzfeld and the inserted color filters are indicated: B, blue; R, red; W ;white; OR, orange; BG, bluegreen. The stimuli B 8, R 8, W 1, and occasionally the maximal intensity flash W16 were applied after dilation of the pupils and 20 min of dark adaptation. The response to the B 8 flash is a pure rod ERG, the matched R 8 stimulus elicits a virtually identical rod component and an earlier and small cone contribution, W 1 and 16 include both rod-and cone responses. The cone-ERG stimuli OR 16, BG 16 and a 30Hz white flicker at intensity setting 4 were applied after 10 min[15] exposure to a full field rod-desensitizing background (23 photp. troland). Left colum, 30 year old control; column CSNB, ERG pattern obtained in a 19 year old femal presenting with congenital stationary night blindness and corrensponding absence of the pure rod response (row B 8) and normal cone ERGs . Achromatopsia: the 12 year old female presents with markedly reduced and delayed cone ERGs (note 10 msec time calibration) maintaned rod ERGs. R. pigmentosa : a 26 year old femal patient affected with the taptoretinal degeneration with autosomal recessive inheritance, revealing extinguished rod and only minimal resuidual cone-b-waves (note higher amplification, scale bar 20µV, and delayed response (time cal. as in adjacent column). The flash coincided with the beginning of each trace.
|
|
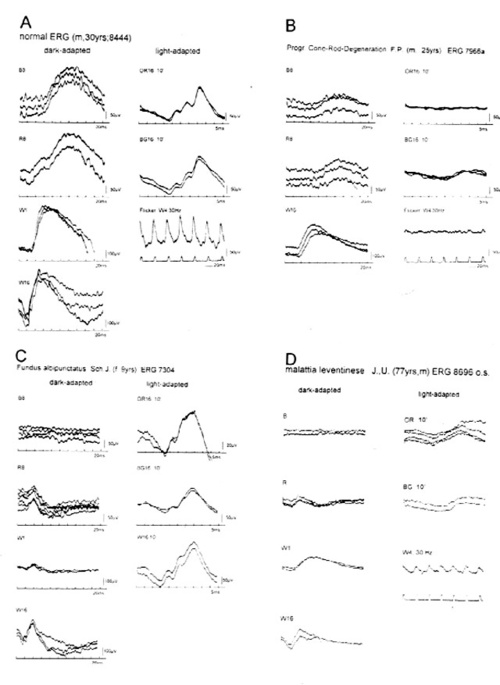
Figure 4
Further examples of rod- and cone ERGs presented at the same scale as the control (panel A) for easy comparison. B, cone rod degeneration, in earlier years also referred to as RP inversa. The differrentiation FROM progressive cone dystrophy cn be difficult until the rods are markedly affected. C, Fundus albipunctatus cum hemeralopia revealed markedly prolonged dark adaptation: the patient reached the normal rod threshold only after 130 min (Goldmann-Weekers adaptometer). The ERG recordings remained essentially unchanged during the past 6 years. D, Malattia leventinese, identical with dominantly inherited drusen of the posterior pole. Note drastsic reduction in amplitudes of both, the cone- and the rod-ERG and also the increased implicit time ot the cone b-wave compared to those in panels A and C.
|
|

Figure 5
Example of ERGs recorded in infants under brief general anesthesia (outpatient basis). Left column: early diagnosis of achromatopsia with well maintained rod ERGs and non-detectable cone ERGs. The right column represents a normal ERG recorded under similar conditions. Note the characteristic response to long wavelength stimulation (R 16) depicting the early cone- and the later rod-b-wave. The cone function is again documented in the 30 Hz white flicker response. A combi- nation of Sevofluran, NO2 and O2 was used to induce, and 1% Sevofluran and only O2 were used for maintaining the anesthesia. Calibration bar: 50 or 100 µV, as indicated.
|
|

Figure 3
Visual field deterioration in patients of different age (abscissa) of 2 generations (ordinate) FROM a large family affected by autosomal dominant RP with an Pro 347 Arg mutation of the rhodopsin gene [33]. DATA were obtained by Goldmann perimetry, the scale of which is indicated in the lower left field. Affected members of this family can typically follow full professional education and activity until about age 30, and they become virtually blind at age 60.Reproduced from[34] Figure 3, with kind permission of Kluwer Academic publishers.
|
|
| Acknowledgements | | I thank Mrs. A.Schaefer for her excellent work in the ERG laboratory, B. Grbovic, M.D., Dept. of Anesthesiology, University Hospital Zürich, for the continuous collaboration, N.Küng, M.D. for constructive comments on the manuscript, and B.Piguet,M.D. Deptm. of Ophthalmology, University Lausanne for referring one patient presenting with Malattia leventinese. | | | References | 1. Heckenlively, J.R.; Arden, G.B. Principles and Practice of Clinical Electrophysiology of Vision. St. Louis: Mosby Year book; 1991.
2. Frishman, L. J.; Steinberg, R. H. Origin of negative potentials in the light adapted ERG of cat retina. J Neurophysiol 63:1333-1346; 1990.
3. Sieving, P. A.; Murayama, K.; Naarendorp, F. Push-pull model of the primate photopic electroretinogram: a role for hyperpolarizing neurons in shaping the b-wave. Vis Neurosci 11:519-532; 1994.
4. Niemeyer, G. Components of the electroretinogram; physiological and clinical aspects. In: C.Cordella and; F.Ponte, eds. Attualità in tema di elettrofisiologia della visione: Monografie della Società Oftalmologica Italiana. Roma: Editoriale I.N.C. 1994:8-19.
5. Steinberg, R. H.; Oakley II, B.; Niemeyer, G. Light-evoked changes in (K+)0 in retina of intact cat eye. J Neurophysiol 44:897-921; 1980.
6. Hood, D. C.; Birch, D. G. A quantitative measure of the electrical activity of human rod photoreceptors using electroretinography. Visual Neuroscience 5:379-387; 1990.
7. Sieving, P. A.; Frishman, L. J.; Steinberg, R. H. Scotopic threshold response of proximal retina in cat. J Neurophysiol 56:1049-1061; 1986.
8. Berninger, T.; Arden, G. B. The pattern electroretinogram. In: Heckelively, J.R.; Arden, G.B. eds. Principles and Practice of clinical electrophysiology of Vision. St. Louis: Mosby Year Book; 1991:291-300.
9. Rungger-Brändle, E.; Kolb, H.; Niemeyer, G. Histochemical demonstration of glycogen in neurons of the cat retina. Invest. Ophthalmol. Vis. Sci. 37:702-715; 1996.
10. Hirsch-Hoffmann, C.; Niemeyer, G. Changes in plasma glucose level affect rod-, but not cone-ERG in the anesthetized cat. Clin. Vision Sci. 8:489-501; 1993.
11. Macaluso, C.; Onoe, S.; Niemeyer, G. Changes in Glucose Level Affect Rod Function More Than Cone Function in the Isolated, Perfused Cat Eye. Invest Ophthalmol Vis Sci 33:2798-2808; 1992.
12. Niemeyer, G. The isolated perfused mammalian eye in retinal pharmacology. In: 10 th Eric K. Fernström Symposium (Agardh, E., and Ehinger,B. eds) Elsevier, Amsterdam,1986:21-31.
13. Jurklies, B.; Kaelin-Lang, A.; Niemeyer, G. Cholinergic effects on cat retina in vitro: changes in rod- and cone-driven b-wave and optic nerve response. Vision Res 36:797-816; 1996.
14. Lansel, N.; Niemeyer, G. Effects of insulin under normal and low glucose on retinal electrophysiology in the perfused cat eye. Invest. Ophthalmol. Vis. Sci. 38:792-799; 1997.
15. Knobel, U.; Niemeyer, G. Amplitudenzunahme der b-Welle des Zapfen-Elektroretinogramms während Helladaptation. Klin. Mbl. Augenheilk. 204:430-434; 1994.
16. Gouras, P. Electroretinography: some basic principles. Invest Ophthalmol 9:557-569; 1970.
17. Berson, E. L.; Gouras, P.; Gunkel, R. D. Rod responses in retinitis pigmentosa, dominantly inherited. Arch Ophthalmol 80:58-67; 1968.
18. Niemeyer, G. Diagnostische Entscheidungen mit Elektroretinographie. In: Huber, A.; Kömpf, D. eds. Klinische Neuroophthalmologie. Stuttgart, New York: Georg Thieme; in press,1997
19. Niemeyer, G. Information von der Netzhaut durch Elektroretinografie. Albrecht Von Graefes Arch Klin Exp Ophthalmol 211:129-137; 1979.
20. Niemeyer, G.; Stähli, P. Elektroretinographie an der Universitäts-Augenklinik Zürich 1989-1994. Klin Monatsbl Augenheilkd 208:306-310; 1996.
21. Niemeyer, G. Indications for rod/cone Ganzfeld electroretinography. Folia. Ophthalmol. Jpn. 42:194-197; 1991.
22. Marmor, M. F.; Zrenner, E. Standard for clinical electroretinography (1994 update). Docum Ophthalmol 89:199-210; 1995.
23. Knobel, U. Amplitudenzunahme der b-Welle des menschlichen Zapfen-Elektroretinogramms während der Helladaptation (Dissertation, University of Zürich). 1995.
24. Andréasson, S.; Sandberg, M. A.; Berson, E. L. Narrow-band filtering for monitoring low-amplitude cone electroretinograms in retinitis pigmentosa. Am J. Ophthalmol 105:500-503; 1988.
25. Andréasson, S. Full-field electroretinograms in tapetoretinal disorders. 1-104; Thesis, University of Lund, Sweden. 1992.
26. Hatt, M.; Niemeyer, G. Elektroretinographie bei Morbus Behcet. Albrecht Von Graefes Arch Klin Exp Ophthalmol 198:113-120; 1976.
27. Niemeyer, G.; Grbovic, B.; Gloor, B. Elektroretinographie-Diagnostik beim Kleinkind. Electroretinographic diagnosis in infants. Klin. Mbl. Augenheilk. 202:417-421; 1993.
28. Fulton, A. B.; Hartmann, E. E.,and; Hansen, R. M. Electrophysiologic testing techniques for children. Docum Ophthalmol 71:341-354; 1989.
29. Ripps, H.; Fishman, G. A. The loss of night vision: clinical manifestations in man and animals. In: Hess, R.F.; Sharpe, L.T.; Nordby, K. eds. Night vision. Basic, clinical and applied aspects. Cambridge: Cambridge University Press; 1990:417-450.
30. Hansen, E. Clinical aspects of achromatopsia. In: Hess, R.F.; Sharpe, L.T.; Nordby, K. eds. Night vision. Basic, clinical and applied aspects. Cambridge: Cambridge University Press; 1997:316-334.
31. Andréasson, S.; Tornqvist, K. Electroretinograms in patients with achromatopsia. Acta Ophthalmol 69:711-716; 1991
32. Berson, E. L. Electrical phenomena in the retina. In: Hart, W.M. ed. Adler's Physiology of the Eye. St, Louis: Mosby Year Book; 1992:641-707.
33. Gal, A.; Artlich, A.; Ludwig, M.; Niemeyer, G.; Olek, K.; Schwinger, E.; Schinzel, A. Pro-347-Arg Mutation of the Rhodopsin Gene in Autosomal Dominant Retinitis Pigmentosa. Genomics 11:468-470; 1991.
34. Niemeyer, G.; Trüb, P.; Schinzel, A.; Gal, A. Clinical and ERG DATA in a family with autosomal dominant RP and Pro-347-Arg mutation in the rhodopsin gene. Docum Ophthalmol 79:303-311; 1992.
35. Pagon, R. A. Retinitis pigmentosa. Surv Ophthalmol 33:137-177; 1988.
36. Pagon, R. A. Syndromic retinal dystrophy. In: E.Rinaldi, ed. Retinitis pigmentosa. Present knowledge and outlook. Napoli, Italy: Liviana Medicina; 1995:151-166.
37. Bird, A. C. Investigation of disease mechanisms in retinits pigmentosa. Ophthalmic pediatrics 13:57-66; 1992.
38. Fishman, G. A.; Grover, S.; Brown, J. Patterns of visual field progression in patients with retinitis pigmentosa. Invest. Ophthalmol. Vis. Sci. 38 (4):S 1122; 1997.
39. Niemeyer, G. Unusual electroretinograms. Dev Ophthalmol 9:40-45; 1984.
40. Niemeyer, G. Rod and cone function in Malattia leventinese compared to retinitis pigmentosa. Doc Ophthalmol Proc Ser 17:337-344; 1978.
41. Scarpatetti, A.; Forni, S.; Niemeyer, G. Die Netzhautfunktion bei Malattia leventinese (dominant drusen). Klin. Mbl. Augenheilk. 172:590-597; 1978.
42. Brischnik, E.; Niemeyer, G. ERG-Veraenderungen bei Uebertraegerinnen x-chromosomaler Retinitis pigmentosa. Klin. Mbl. Augenheilk. 192:387-390; 1988.
43. Stähli, P.; Leitung: G.Niemeyer Zur Differentialdiagnose hereditärer Netzhautdegenerationen mittels Elektroretinographie: Kasuistik 1989 -1994 Thesis, University of Zürich. 1-94; 1995. | | | Tables |
Table I: Normal fundus - abnormal ERG
achromatopsia |
congenital stationary night blindness |
Leberís congenital amaurosis |
progressive cone dystrophy |
early stage of retinitis pigmentosa |
toxic retinopathy |
I conclude with a brief list of diagnostic decisions that require ERG
testing (Table II) and that frequently present problems, at least upon the
patients first visit.
Table II: Decisions supported by ERG testing
nightblind |
&laqno; |
dayblind |
congenital (stationary) disorder |
&laqno; |
progressive, degenerative disorder |
progressive cone dystrophy |
&laqno; |
cone-rod degneration |
Fundus albipunctatus |
&laqno; |
retinitis punctata albescens |
chorioideremia |
&laqno; |
gyrate atrophy |
CSNB |
&laqno; |
very slowly progr. RP |
carrier of X-linked RP |
&laqno; |
dominant RP |
late onset, mild RP |
&laqno; |
toxic retinal dysfunction |
isolate RP |
&laqno; |
syndromic RP |
impaired retinal function |
&laqno; |
hysterical visual disturbance |
A recent overview of the distribution of Ganzfeld rod-and cone ERGs in
the Deprtment of Ophthalmology , University Hospital Zürich, has been published [20,43]. | |
|
|
|
|
|
|
 Welcome, please sign in