|
|
 |
|
|
|
|
|
A 71-year-old woman with decreased vision, nyctalopia, and peripheral vision loss
Digital Journal of Ophthalmology 2016
Volume 22, Number 4
December 31, 2016
DOI: 10.5693/djo.02.2016.06.001
|
Printer Friendly
Download PDF |
|
|
 Ravi Parikh, MD, MPH
 | Department of Ophthalmology and Visual Science, Yale University, New Haven, Connecticut Miguel A. Materin, MD | Department of Ophthalmology and Visual Science, Yale University, New Haven, Connecticut; Smilow Hospital at Yale New Haven Hospital Robert Lesser MD | Eye Care Group, New Haven, Connecticut Joachim Baehring, MD, PhD | Smilow Hospital at Yale New Haven Hospital; Department of Neurology, Yale University, New Haven, Connecticut Mario Sznol, MD | Smilow Hospital at Yale New Haven Hospital; Department of Internal Medicine, Yale University, New Haven, Connecticut Jennifer A. Galvin MD | Department of Ophthalmology and Visual Science, Yale University, New Haven, Connecticut
|
|
|
| Ancillary Testing | Magnetic resonance imaging of the brain with and without contrast was negative for metastatic disease. No further genetic tests for neoplasm were recommended by the oncology team.
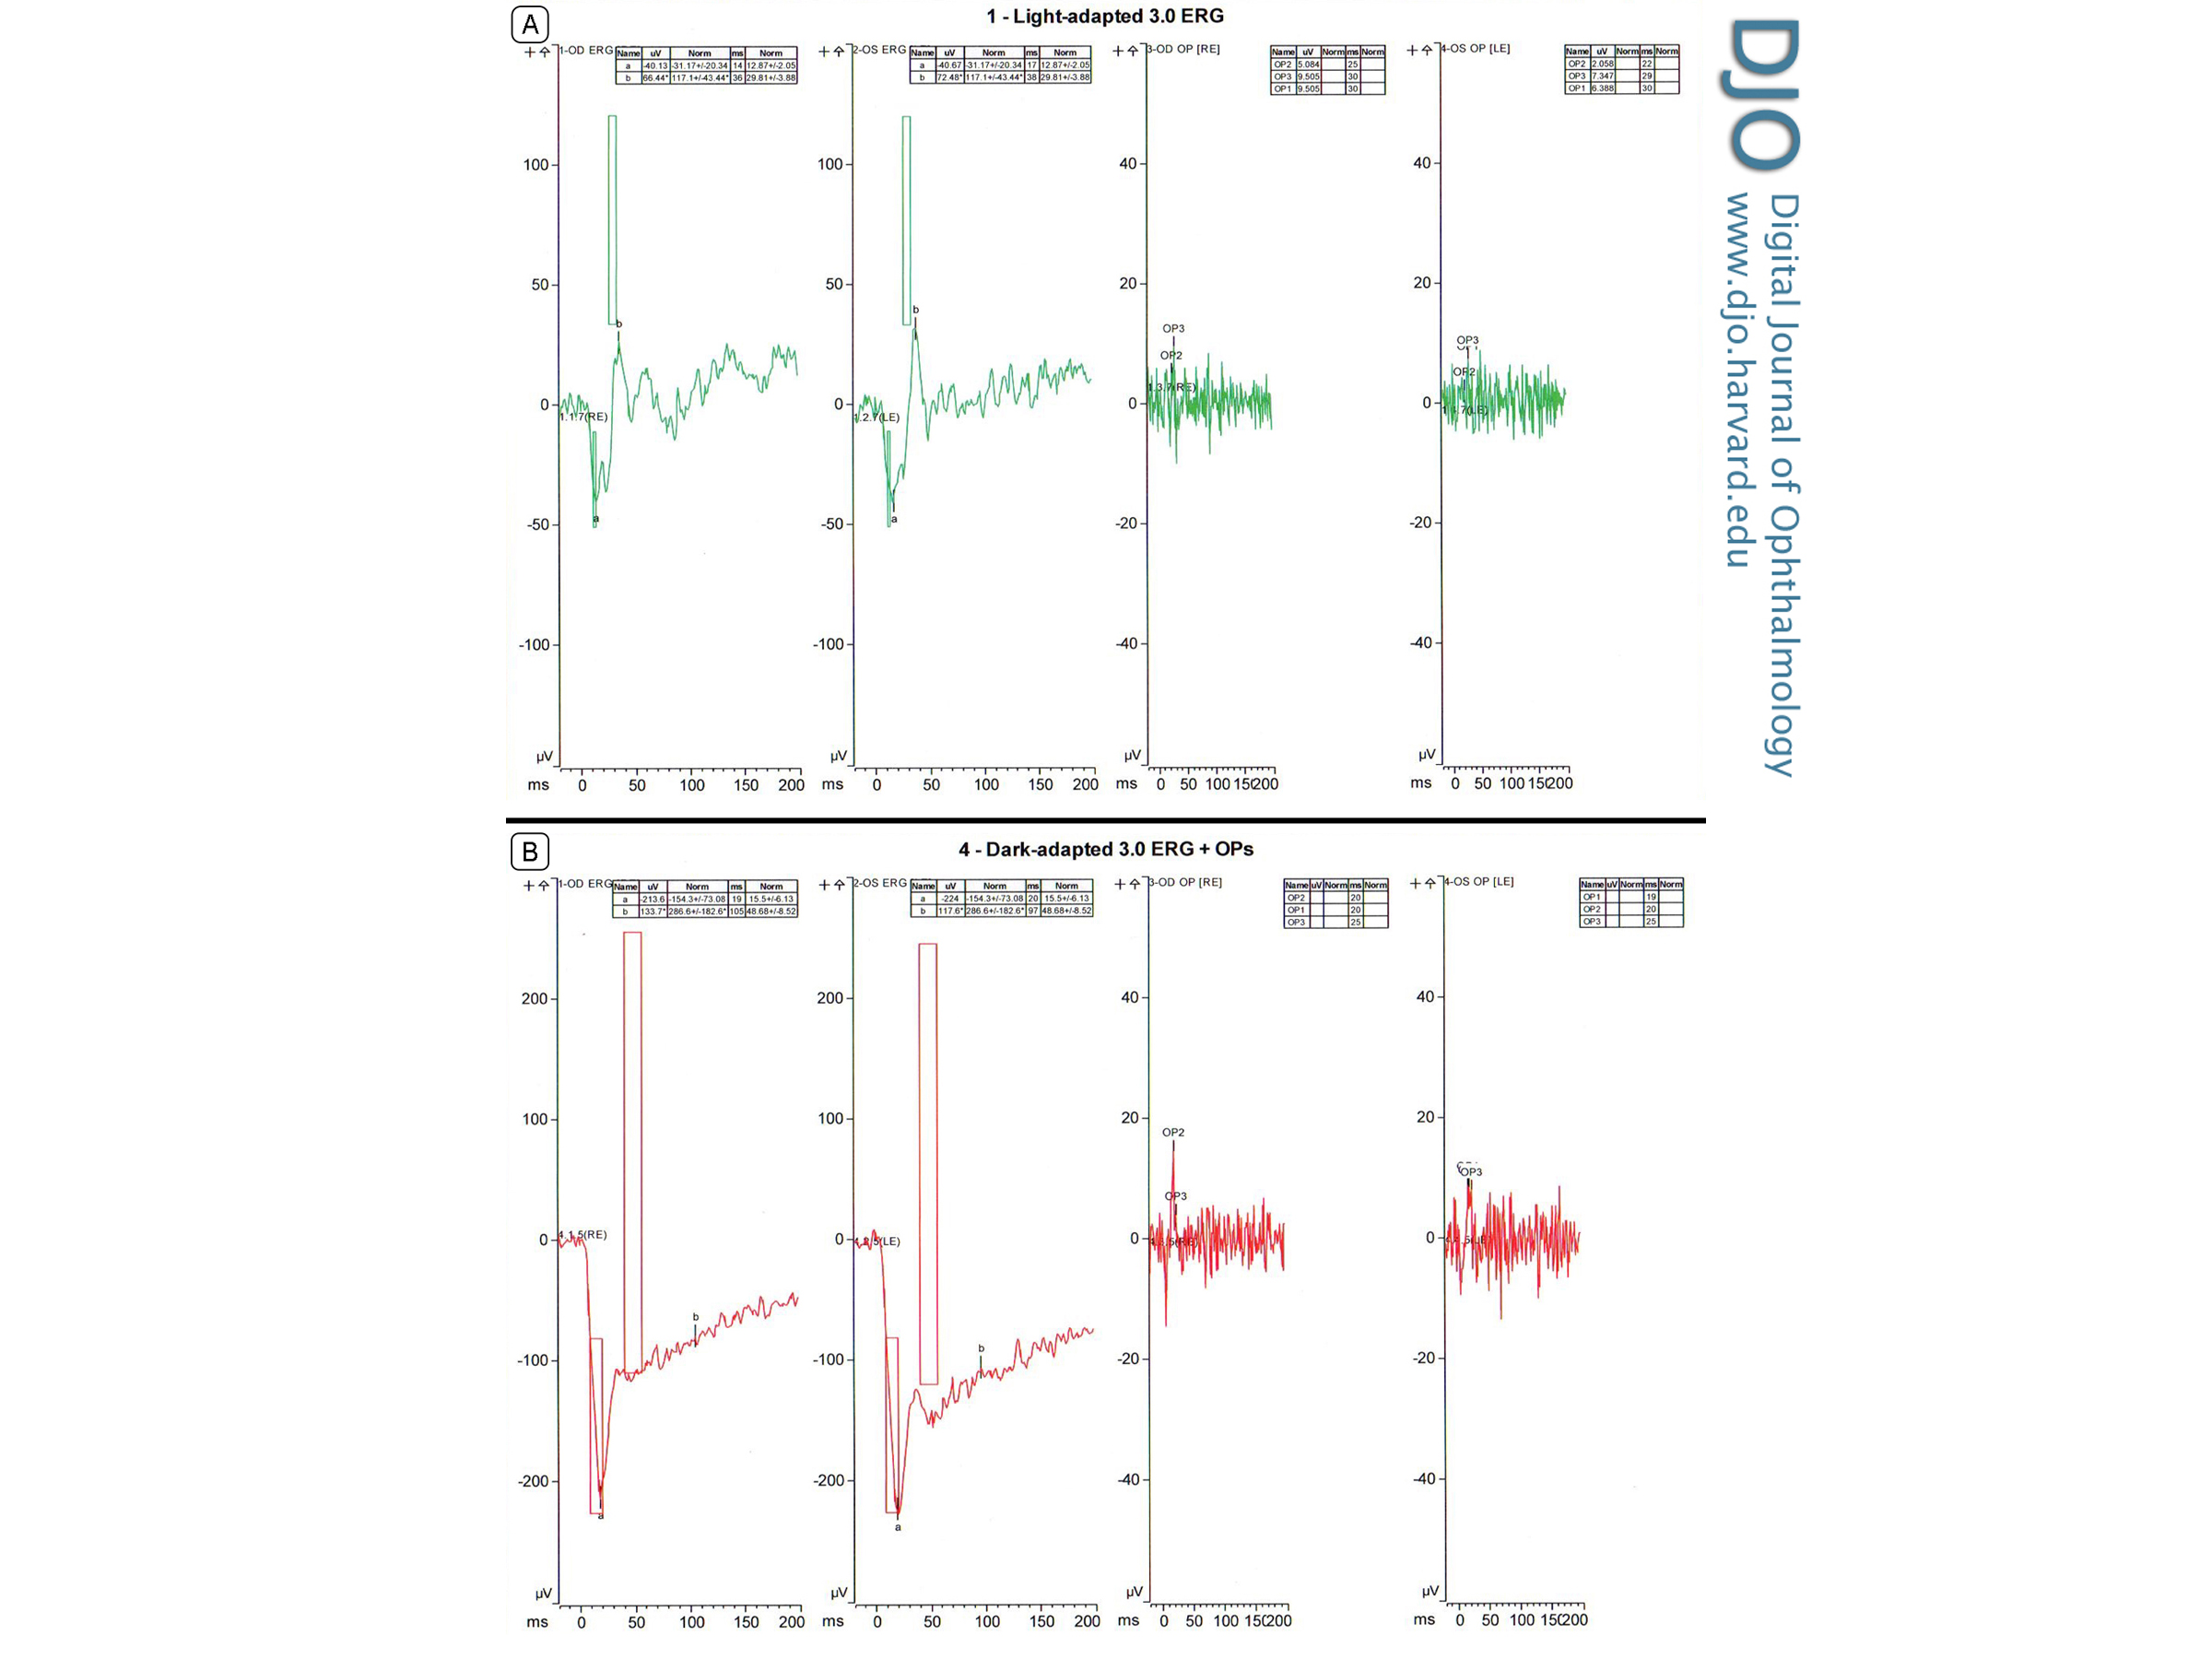
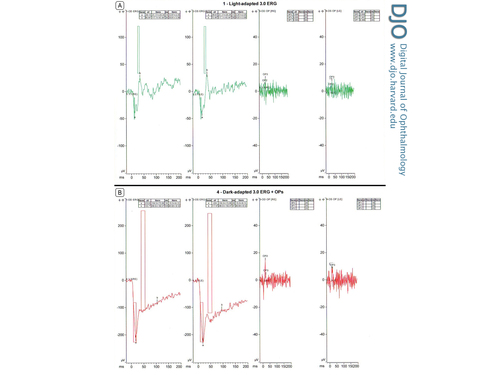
Full-field electroretinogram (ff ERG) in each eye showed, in photopic (light adaptation) conditions, normal a-wave and decreased b-wave (Figure 2A). The a-wave was −40.13 µV in the right eye and −40.67 µV in the left eye as well as 14 ms and 17 ms, respectively (normal range, −31.17 ± 20.34 µV and 12.87 ± 2.05 ms). The b-wave was abnormal, at 66.4 µV in the right eye and 72.48 µV in the left eye and 38 ms (normal range, 117.1 ± 43.44 µV and 29.81 ± 3.88 ms). In single-flash scotopic (dark adaptation) conditions, there were broadened a-waves and decreased b-waves as well as a decreased b/a ratio. (Figure 2B). The a-wave is −213.6 µV in the right eye and −224 µV in the left eye as well as 19 ms and 20 ms, respectively (normal range, −154.3 ± 73.08 µV and 15.5 ± 6.13 ms). The b-wave in contrast was abnormal. The b-wave measured to 133.7 µV in the right eye and 117.6 µV in the left eye and 105 ms and 97 ms, respectively (normal range, 286.6 ± 182.6 µV and 48.68 ± 8.52 ms).
Laboratory work-up included an evaluation for paraneoplastic disease. Serum sent to Athena Diagnostics (Marlborough, MA) were negative for the antiretinal autoantibodies against the 23kDa cancer-associated retinopathy (CAR) recoverin protein; but serum sent to the Ocular Immunology Laboratory at Casey Eye Institute (Portland, Oregon) were positive for the antiretinal autoantibodies against the 46kDa enolase protein.
Vitreous biopsy of the left eye showed atypical lymphocytes, inconclusive for vitreous lymphoma. The flow cytometry result demonstrated a “paucicellular specimen with scattered atypical lympocytes.”
Fluorescein angiogram showed no hallmark “leopard spot” changes at the level of the retinal pigment epithelium. Thus, the overall clinical picture was more suggestive of a smoldering low-grade vitritis rather than an ocular lymphoma.
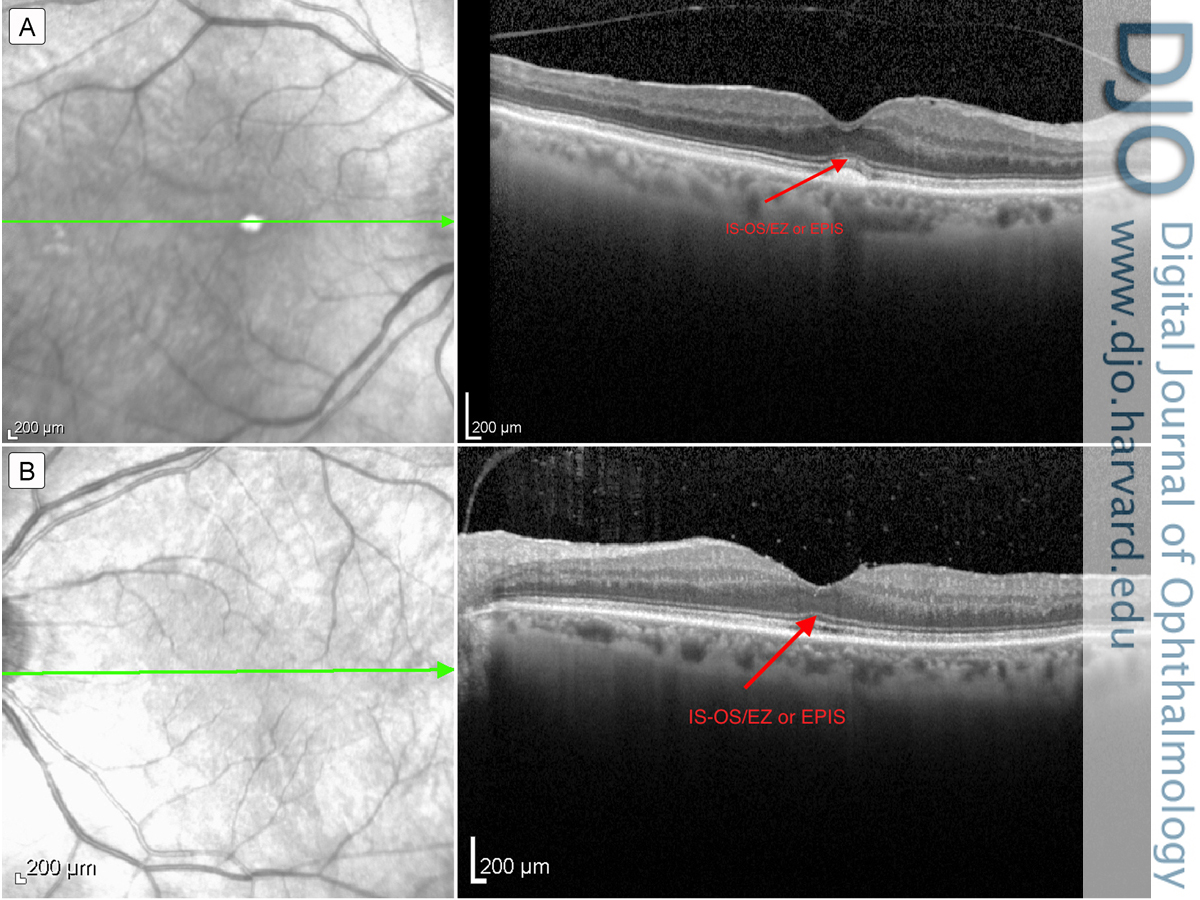
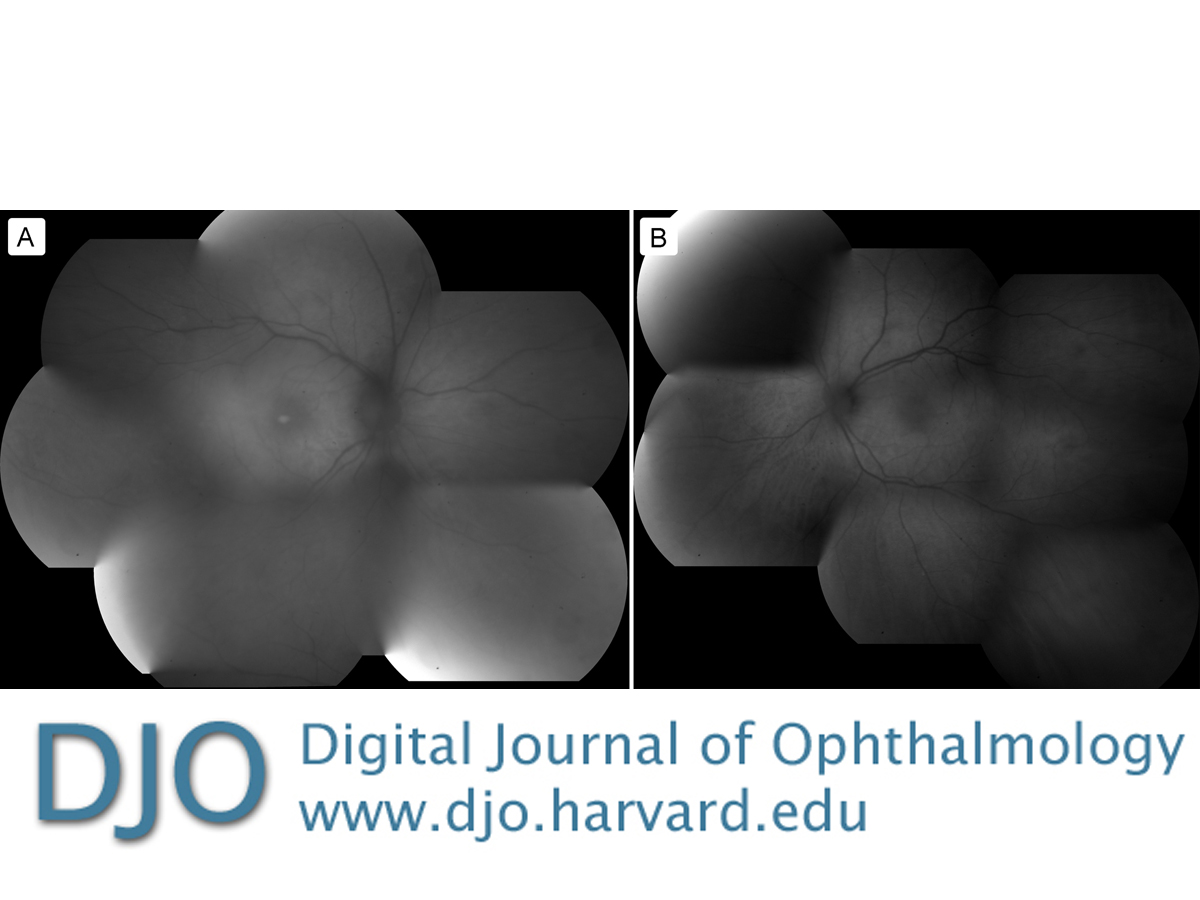
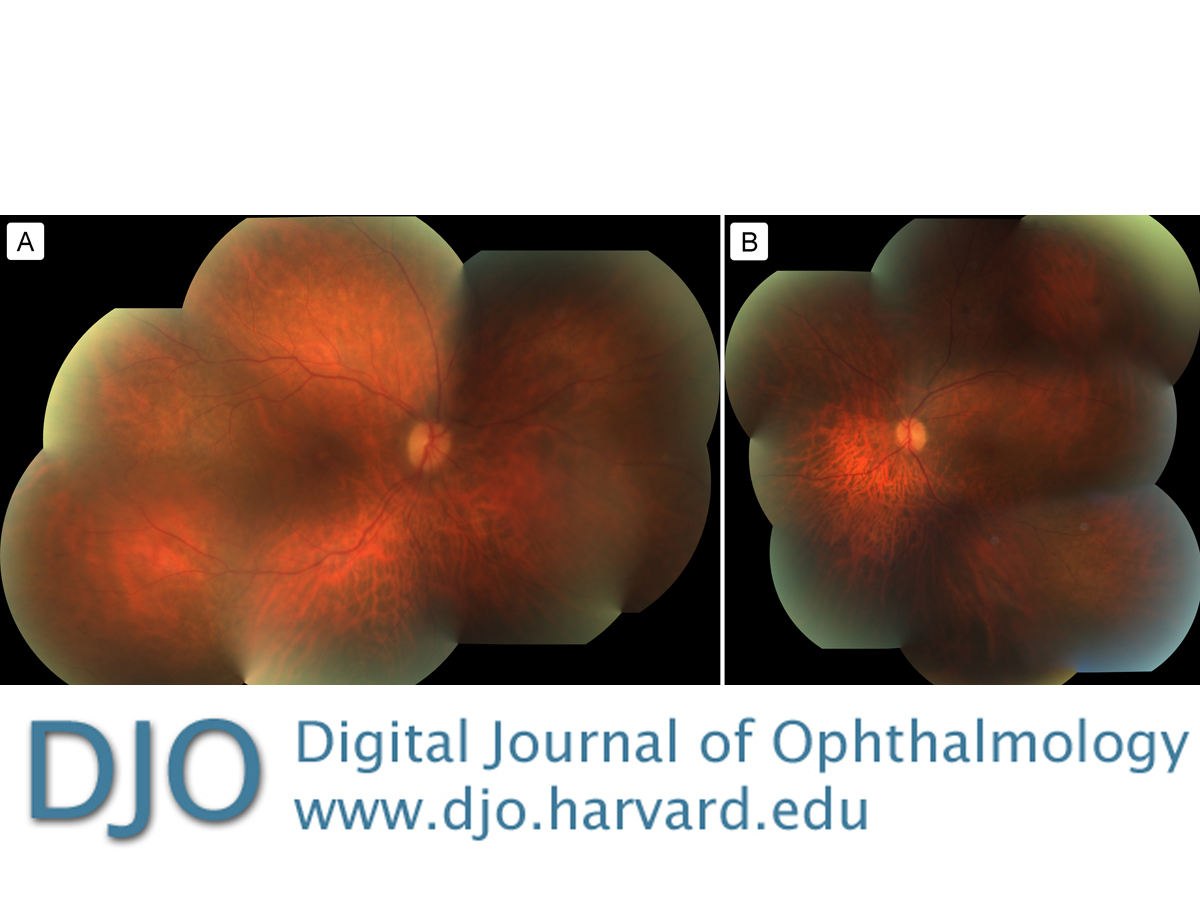
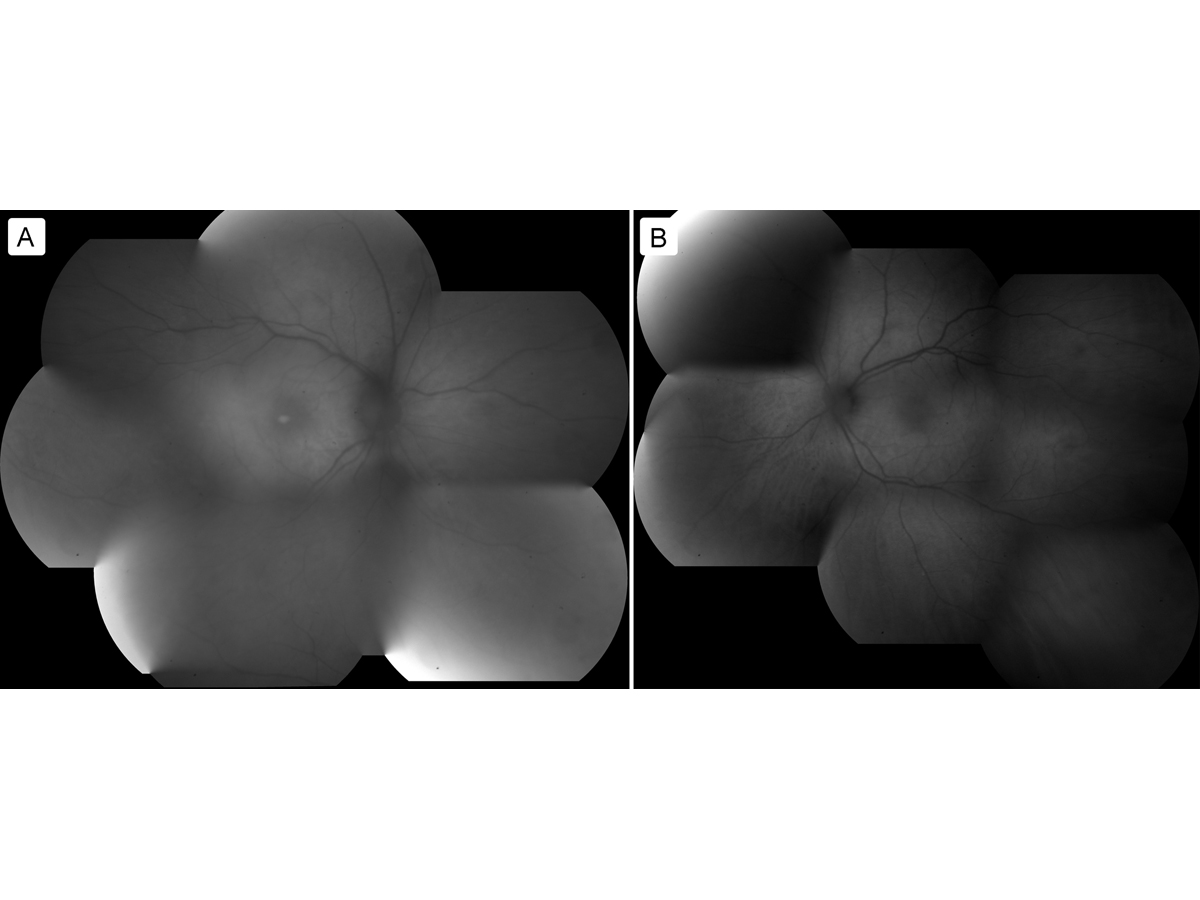
Spectral domain optical coherence tomography (SD-OCT) of the maculae did not appear to show attenuation of the ellipsoid zone (Figure 3). Further fundus autofluorescence also did not show any ring maculopathy (Figure 4). Fundus photographs confirmed clinical examination findings, showing only a mild attenuation of the vessels with no apparent maculopathy in either eye (Figure 5).
A positron emission tomography computerized tomography (CT) scan showed hypermetabolic uptake in a 4.8 cm left axillary lymph node without any other pathologic uptake. A left axillary lymph node dissection revealed involvement of one lymph node for melanoma, whereas six additional lymph nodes were negative for metastatic disease. | |
|
Figure 2
A, Photopic full-field electroretinogram (ffERG), right eye and left eye. B, Single-flash scotopic ffERG, right eye and left eye.
 |
|
|
Figure 3
Optical coherence tomography of the macula: right eye (A) and left eye (B), with arrow indicating the inner segment–outer segment / ellipsoid zone or ellipsoid portion of inner segment (IS-OS/EZ or EPIS).
 |
|
|
Figure 4
Fundus autofluorescence: right eye (A) and left eye (B).
 |
|
|
Figure 5
Fundus photographs of the right eye (A) and left eye (B).
 |
|
|
|
|
|
|
|
 Welcome, please sign in